| Weather pictures & report of July 14 2010 |
| MCS (squall line) thunderstorm along convergence line. |
| Synopsis: at 500 hPa, east of a relaxing trough west of the British Isles, our area in a moderate SW'ly flow of warm and humid potentially unstable air. At surface passage of thermal depression, related convergence line enhanced the instability which started from noon over France. From the afternoon on, a developing MCS thunderstorm entered the S of Belgium moving NE-wards. It evolved over central and eastern parts to a trailing stratiform squall-line with several bow echo segments resulting in wind damage at many locations, mostly due to downbursts. Over central Belgium it resulted again (third within five days) in a nice shelf cloud. Unless otherwise stated, all pictures were taken at Steenokkerzeel (central Belgium), hours in local time (CET). |
 |
|
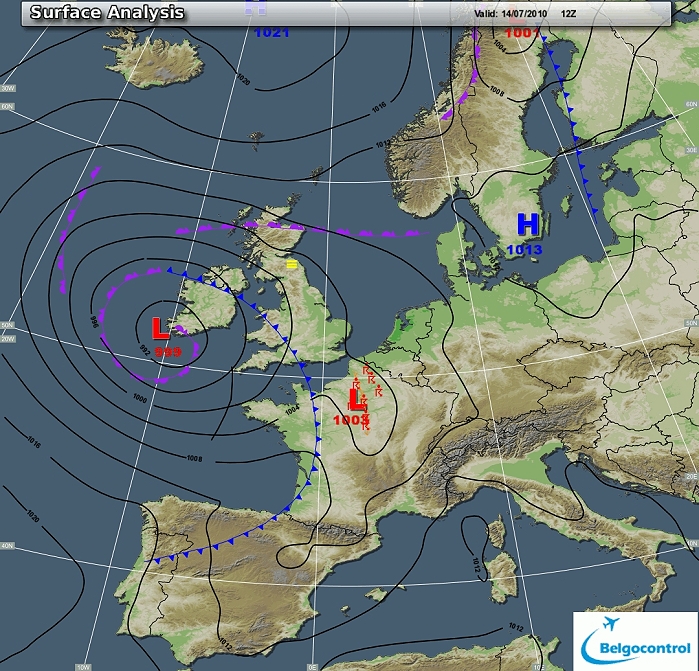
Surface analysis of July 14 2010 at 1400 CET. Related to a thermal
depression over the channel, a convergence line over northwest France
which crossed Belgium during the afternoon from SW to NE. (Source chart: Belgocontrol)
|
|
Loop of 8 surface analyses (of each hour between 1300 - 2000 CET) with
weather plots showing the slow movement of the thermal depression. (Source: meteocentre.com)
|
 |
|
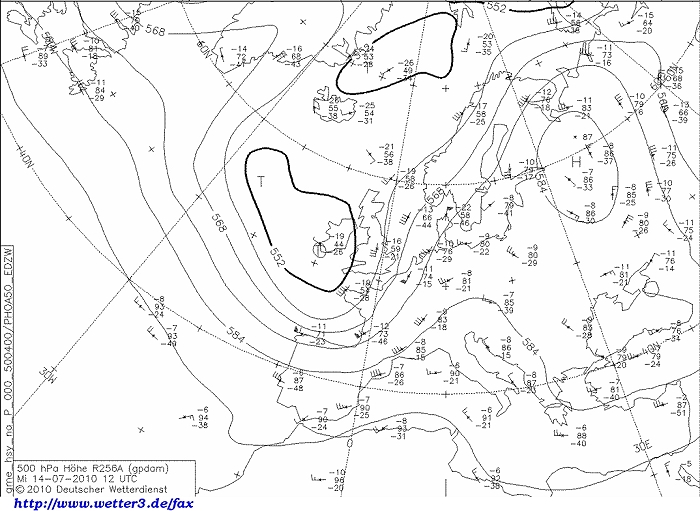
Upper air analysis 500 hPa of July 14 2010 at 1400 CET. Related to a low
near Ireland, a relaxing long wave trough over
the Gulf of Biskaye moving eastwards. On the other hand a retreating
ridge near Austria. Our area in a strong SW'ly airflow. (Source chart: DWD via wetter3)
|
 |
|
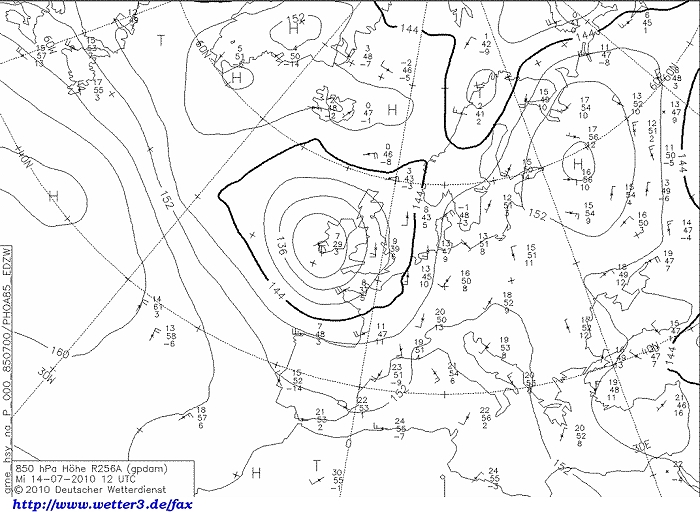
Upper air analysis 850 hPa of July 14 2010 at 1400 CET. Recognizable in
the strengthening SW'ly flow is a relative strong temperatures gradient: overhead 13°C and a bit further to the west dropping to
8°C . (Source chart: DWD via wetter3)
|
 |
|
Loop of forecasted soundings for Brussels of July 14 2010 between
0830-2000 CET. Deep instability is present from 750 hPa upwards,
initially a strong inversion is present but cleared from 1500 CET
onwards. Around this time shear in speed has become quite strong: low
level (0-3 km) 40 kt, deep layer (0-6km) 50 kt. Besides this, relative
helicity SREH 0-3
km was temporary moderate with values >200 m²/s². Together with moderate CAPE this enhanced
the risk of
large multicells (MCS) eventually preceded by supercells. (Source: RASP)
|
|
Another loop of forecasted soundings for a 12 hours period (in steps of
three hours) of Brussels from July 14 2010, 1100 CET onwards. Included
are some thunderstorms indices: surface based CAPE went up to around 1500 J/kg, KI 38, TT
52, LI -5 = strong convective
potential which may lead to scattered to numerous thunderstorms,
scattered severe. (Source: weatheronline.co.uk)
|
|
14/07/2010 1500-1930 CET. Satellite loop in the visual channel.
Exploding MCS comes in from the north of France. Severe activity (mainly
downbursts) was to be found in many parts of Belgium except for the northwestern
provinces. (Source sat
picture: Eumetsat via Sat24.com)
|
 |
|
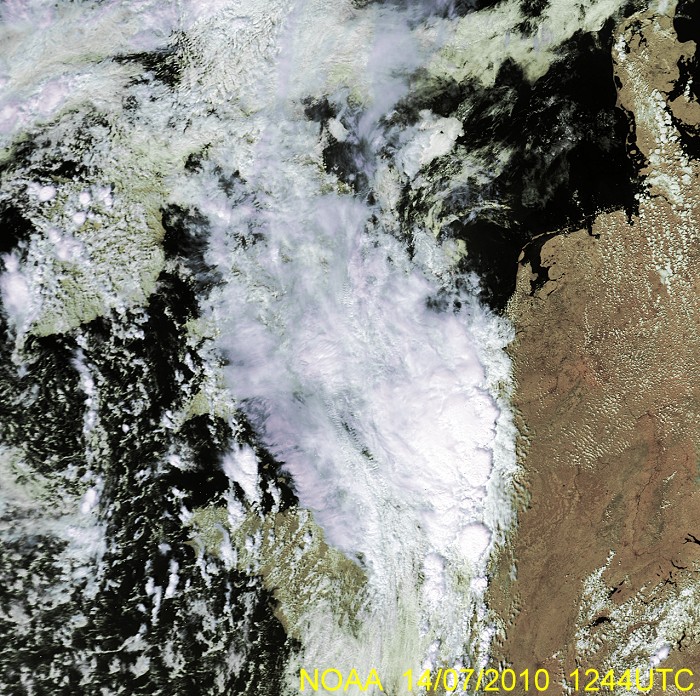
14/07/2010. Still image in the visible channel showing the exploding Cb's
on a NNW-SSE orientated line. (Source picture: NOAA)
|
 |
|
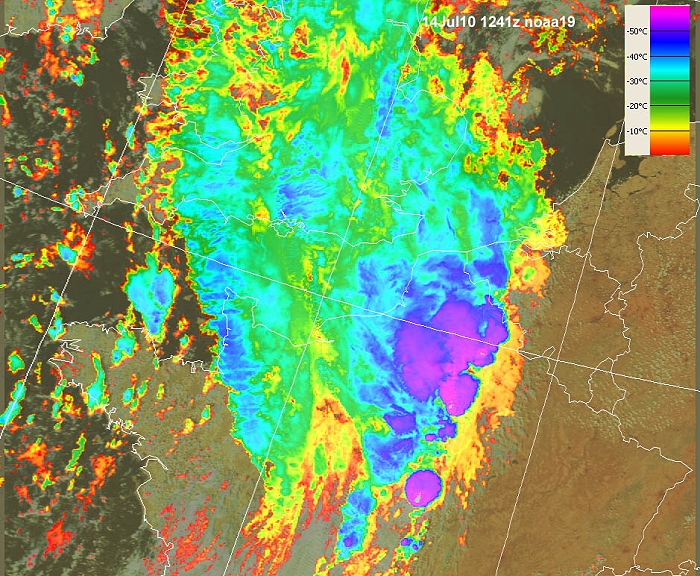
14/07/2010. With corresponding temperature scale on which can be
concluded that at that time the most active cells were still just south
of the Belgian border. (Source picture: NOAA via woksat.info)
|
 |
|
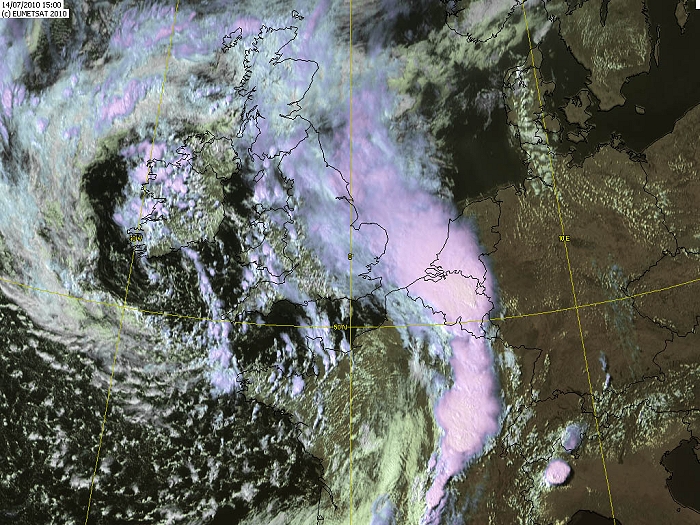
14/07/2010. Couple of hours later in this wider view, first evidence of
an MCS in form of a squall line. (Source picture: Metsat via woksat.info)
|
Radar loop (rainfall rate in mm/hr) of July 14 2010 between 1440-1950 CET. An extensive precipitation belt comes in from the SW. Most intense echo's were to be found over the provinces Hainaut and Namur. A squall line with several bow echo segments developed over the Ardennes (although on these 125 km radius images not very good identifiable). Precipitation tops went up to around an impressive 16 km. (Source radar picture: Belgocontrol)
|
 |
|
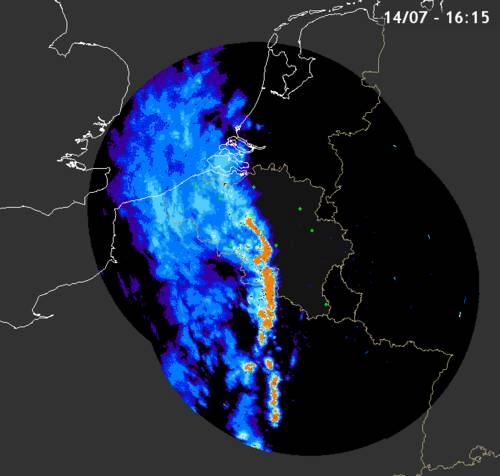
14/07/2010. Composite radar image of 1615 CET where the MCS
indicates a squall
line (orange colors) with on the northern side also a bow echo. On this
line (especially along the bow echo) local wind damage was to be found
and considering the length of the entire line it could be labeled as a derecho.
Furthermore it reveals that this quasi linear squall line is of the
stratiform trailing type (Source picture: IRM via
Meteoservices)
|
Corresponding discharges of July 14 2010 between 1515-1815 CET giving again clue to the appearance of a long squall line. (Source lightning picture: Euclid)
|
 |
|
14/07/2010. Zooming in over Belgium it shows that most activity was to be found over
a line east of Ath-Brussels-Turnhout. (Source picture: Buienradar)
|
Some metars (hours in UTC). Translation: copy
paste each obs via
metar-decoder
Metars of Charleroi (EBCI) which gave more info regarding the events that
happened also at Brussels
Metars of Bierset (EBLG)
Metars of Florennes (EBFS) where speci report are still included with
more detailed info regarding timing of the storm. |
 |
|
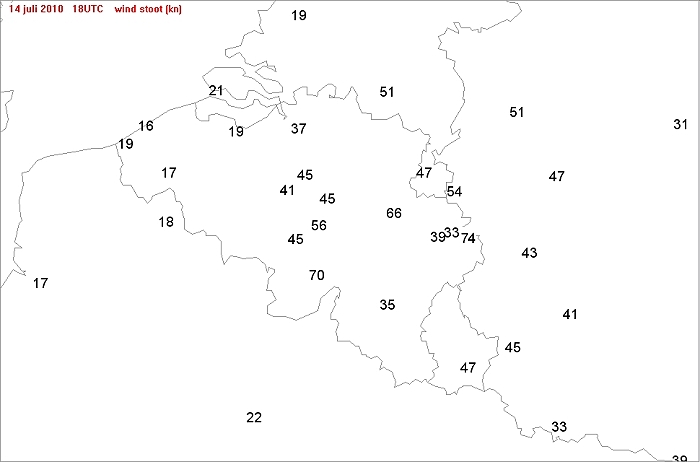
14/07/2010. Observed wind gust (in kt) of the official Met stations showing values between 45-74 kt over the
south, center and east. At Brussels Airport 45 kt was offically
recorded, but one unoffical anemometer gave a gust of 63 kt.
|
 |
|
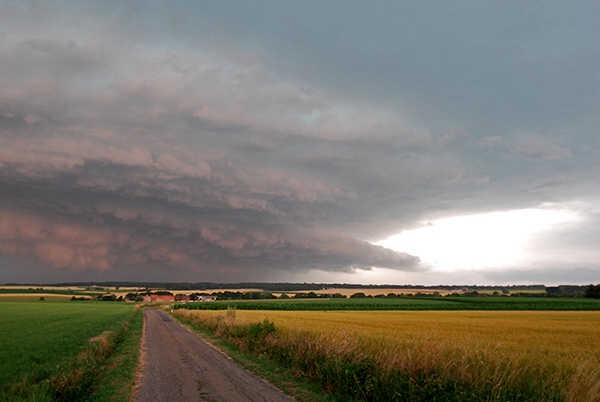
14/07/2010 1530. This threatening sky
appeared at Merbes-le-Chateau (south of province Hainaut) and it
corresponds with the most intense echo to be found on the radar
pictures. Near this location large hail of around 4 cm diameter was
observed. (Source picture: "Maka" on forum Meteobelgium)
|
 |
|
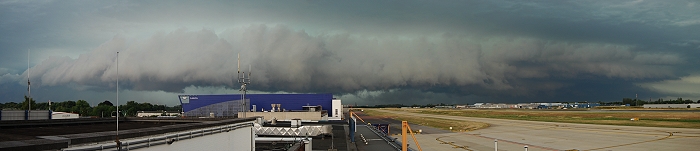
14/07/2010 1610. Panoramic view at Gosselies (Brussels South) with
approaching arcus cloud (Source pic: V. Bouchez)
|
 |
|
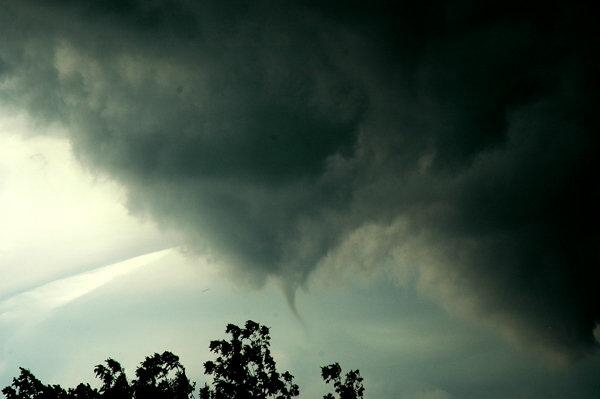
14/07/2010 1620. Tuba features were
visible near Namur. This could support the theory that a tornado might
be responsible for the most intense wind damage of the entire country
which was to found a bit further to the east, namely in Ciney, province
Namur. (Source picture: via Sébastien Verachtert on forum Meteobelgium)
|
 |
|
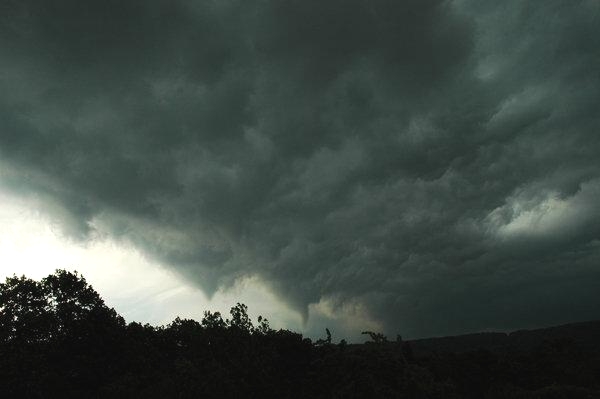
14/07/2010 1620. Wider view on
several tuba's. (Source picture: via Sébastien Verachtert on forum
Meteobelgium)
|
 |
|
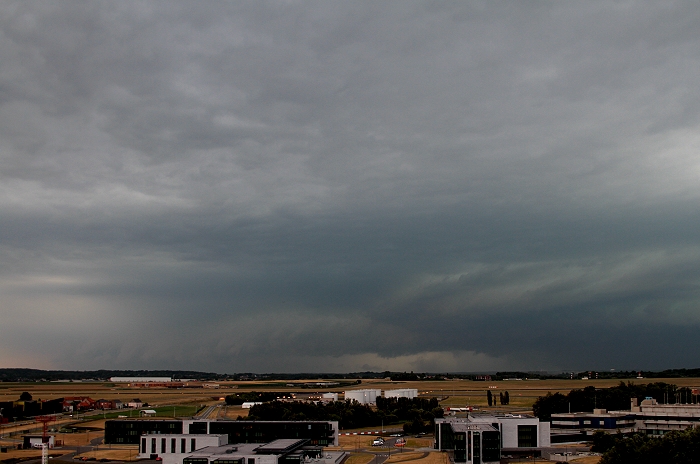
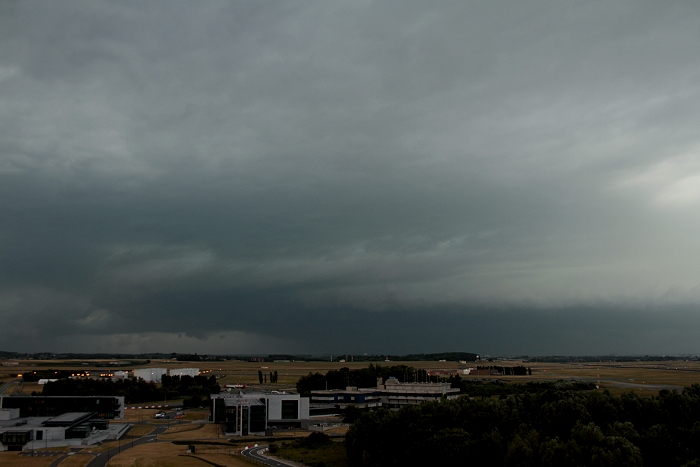
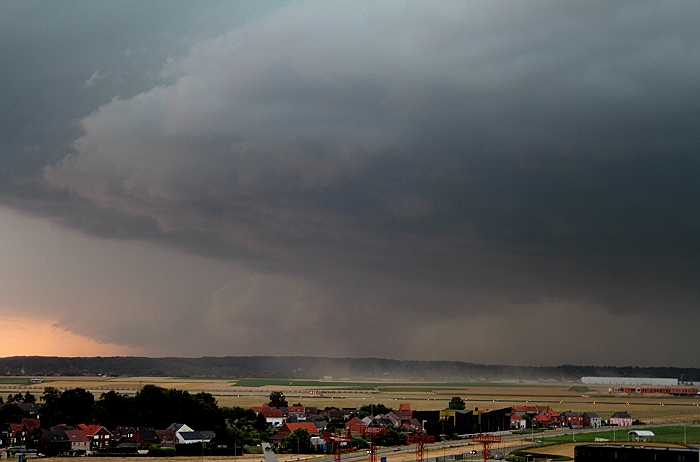
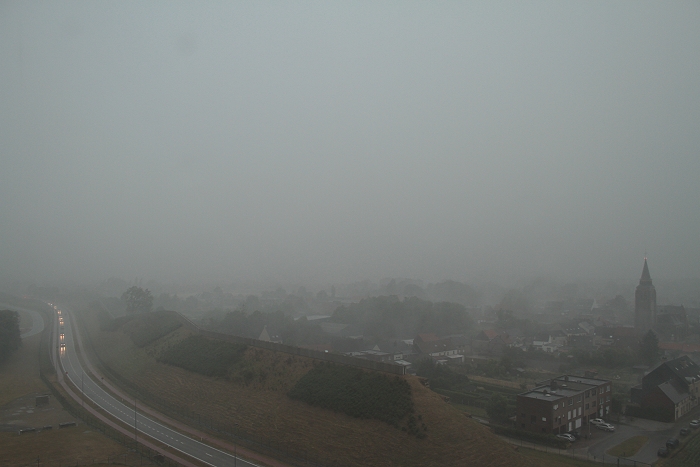
14/07/2010 1619 S. Events from my point of view in the center of
Belgium located at "BR" on the radar pictures: first glimpse of an incoming arcus cloud which in the
far south looked quite impressive.
|
 |
|
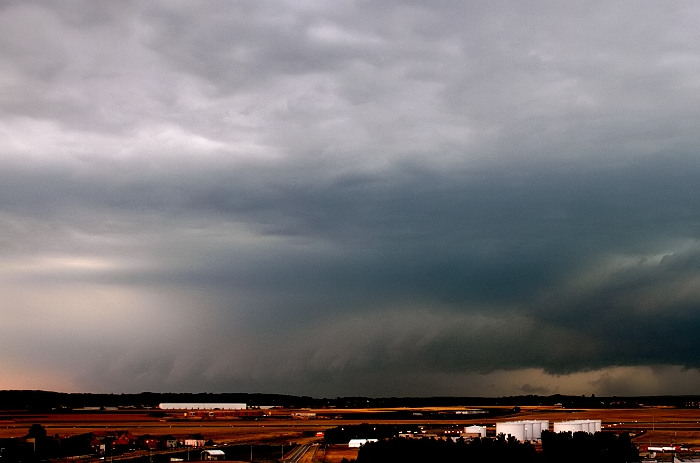
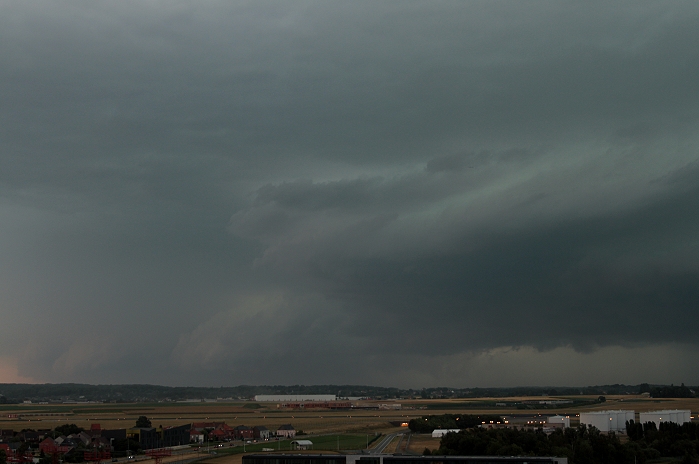
14/07/2010 1619 S. Zoomed in with a bit enhanced contrast.
|
 |
|
14/07/2010 1621 SW. The view more to the west was less impressive.
|
 |
|
14/07/2010 1624 S. Evolution of southern side.
|
 |
|
14/07/2010 1626 S.
|
 |
|
14/07/2010 1629 S.
|
 |
|
14/07/2010 1626 S. Zoomed in on the blowing dust of the arriving wind gusts.
|
 |
|
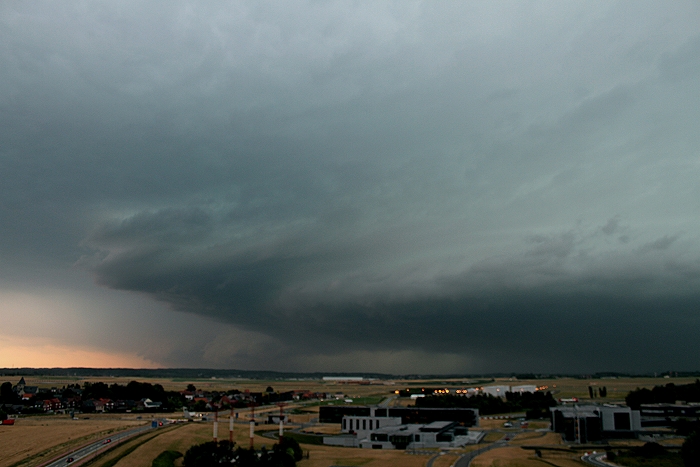
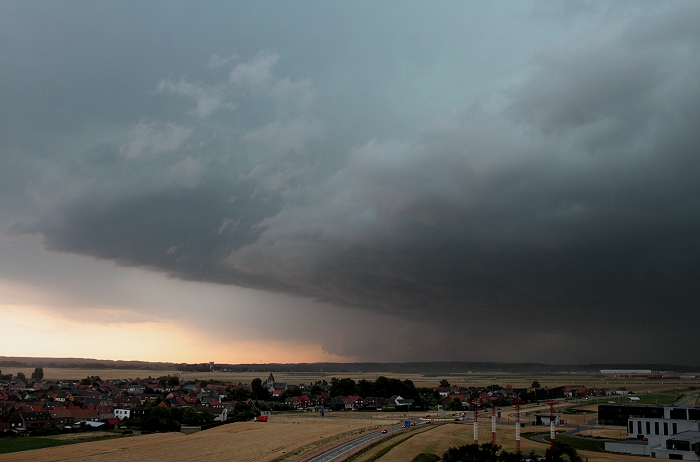
14/07/2010 1630 S. Final clear view on the approaching shelf.
|
 |
|
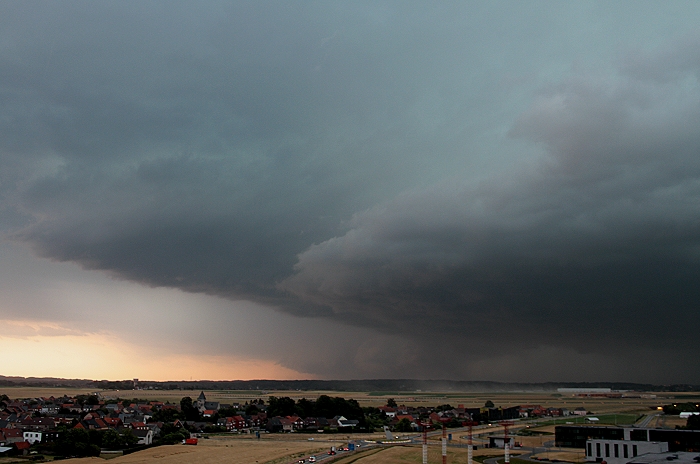
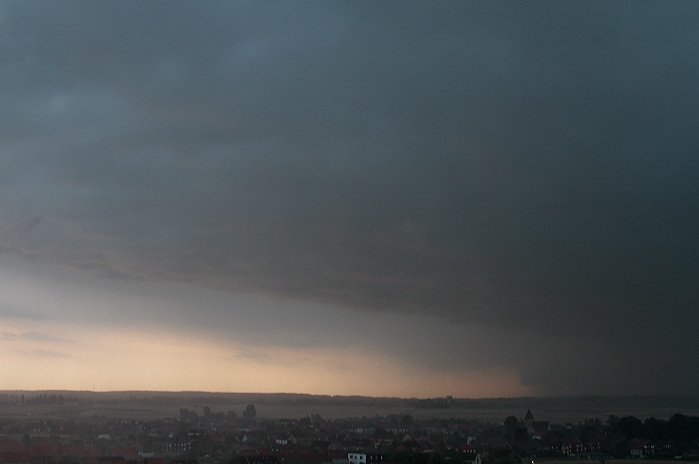
14/07/2010 1632 SSE. Precipitation arrived with blustering winds of
around 45 kt or perhpas even more as one of the unofficial anemometers showed a
peak of 63 kt.
|
 |
|
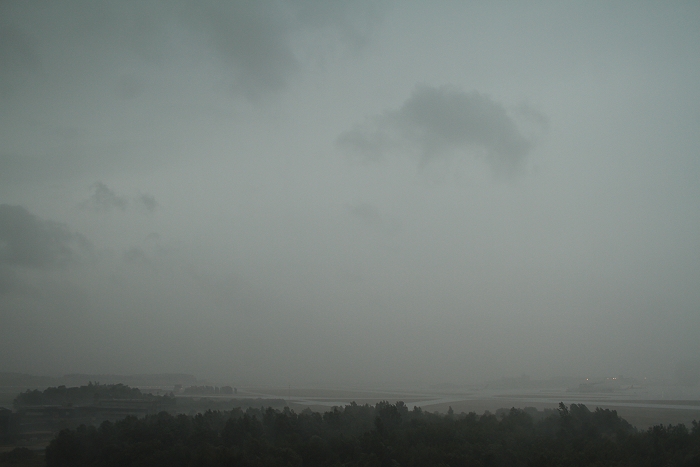
14/07/2010 1634 SW. View towards the airport, obscured by the precipitation.
|
 |
|
14/07/2010 1641 NE. Opposite view towards Steenokkerzeel village. A total of
18 mm water was collected.
|
|
To summarize things: time lapse of the events between 1618-1631 CET with
view to the south showing the approach and passage of a thunderstorm
with shelf cloud and severe wind gusts. Catching feature is undoubtly
the contrary wind that can be detected via the clouds which gave of
course severe turbulence closing the airport for half an hour.
|
 |
|
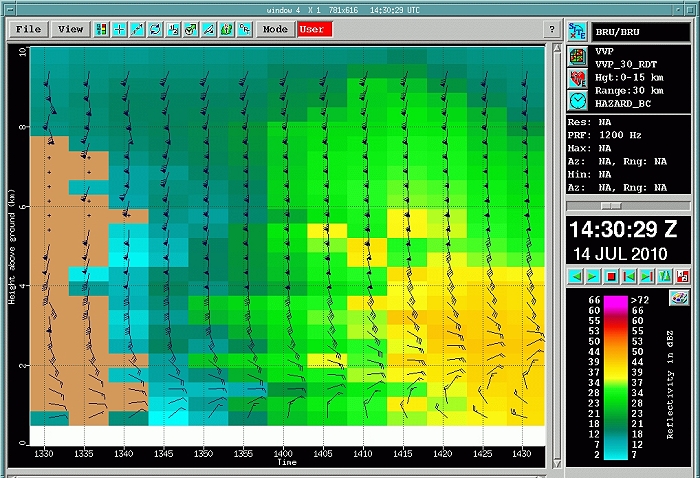
14/07/2010. Corresponding radar wind profiler at Brussels Airport
between 1530-1630 CET giving clear evidence of a sharp directional shear
in the lowest 4 km. Legend: vertical axis height in km, horizontal
axis time step each five minute with the oldest data on the left hand
side (Source radar picture: Belgocontrol).
|
 |
|
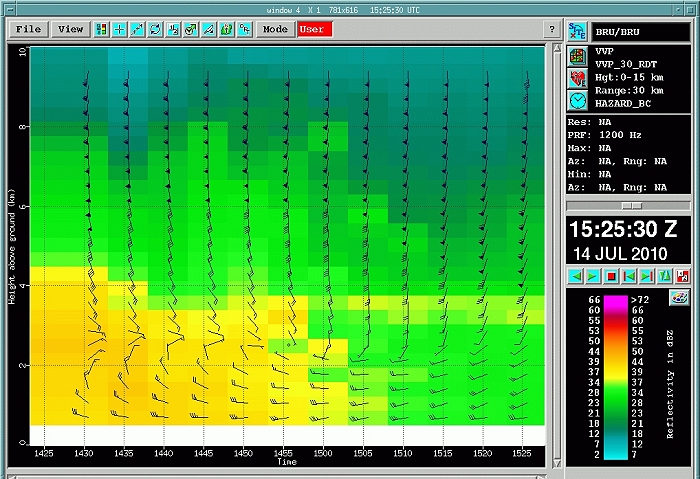
14/07/2010. Another radar wind profiler at Brussels Airport
between 1625-1725 CET (Source radar picture: Belgocontrol).
|