| Weather pictures & report of January 20 2013 |
| Snow related to an occlusion |
| Synopsis: at 500 hPa a relaxing trough over the United Kingdom - France moved E-NE-wards.Related surface depression over E-France with wrapped around occlusion moved however NW-wards. It gave an accumulation between 2-5 cm. Pictures taken at Kampenhout. Hours in local time (CET). |
 |
|
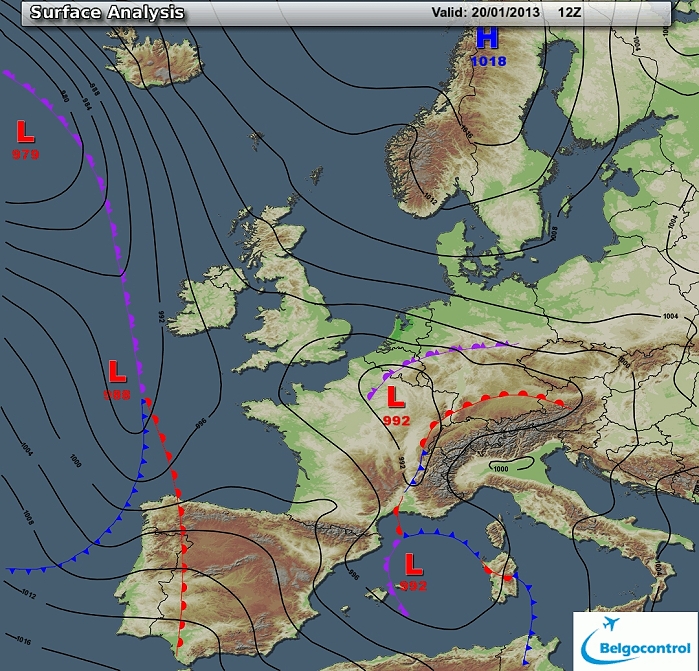
Surface analysis of January 20 2013 at 1300 CET. Complex low extending
from North France to the Mediterranean Sea with the upper depression
with related occlusion moving NW-wards. (Source chart: Belgocontrol)
|
|
Loop of 16 surface analyses of each hour of January 20 2013
between 0400-1900 CET with the weather plots showing the slow movement
of the depression NW-wards with snow falling over the Low Countries by always negative temperatures. (Source: meteocentre.com)
|
 |
|
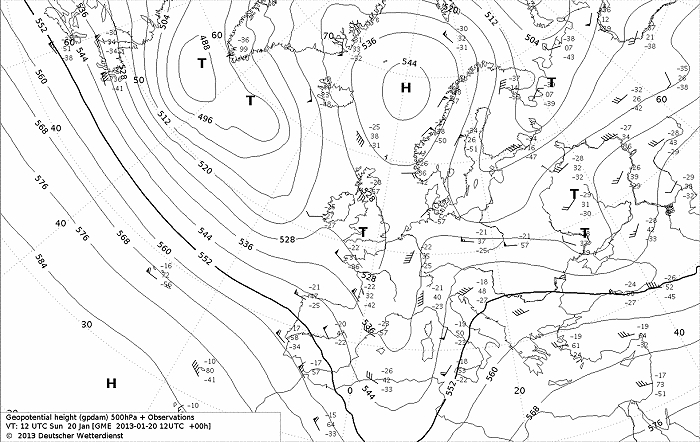
Upper air analysis 500 hPa of January 20 2013 at 1300 CET. A relaxing
trough over the U.K. and France was moving ENE-wards. (Source chart: DWD via wetter3)
|
 |
|
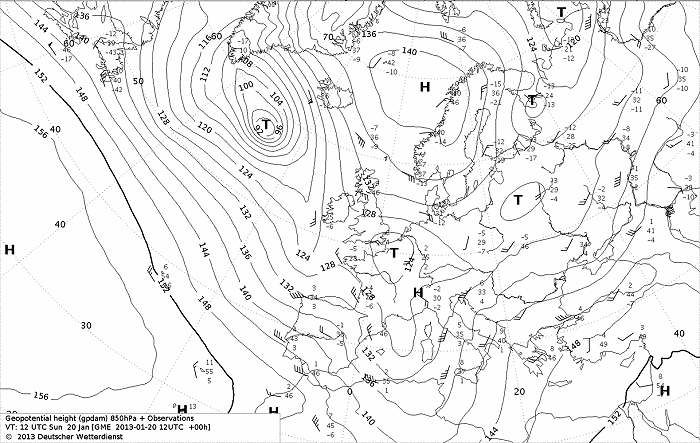
Upper air analysis 850 hPa of January 20 2013 at 1300 CET. Depression
recognizable over N-France moved slowly NNW-wards.
Isotherm of -5°C was initially overhead. (Source chart: DWD via wetter3)
|
 |
|
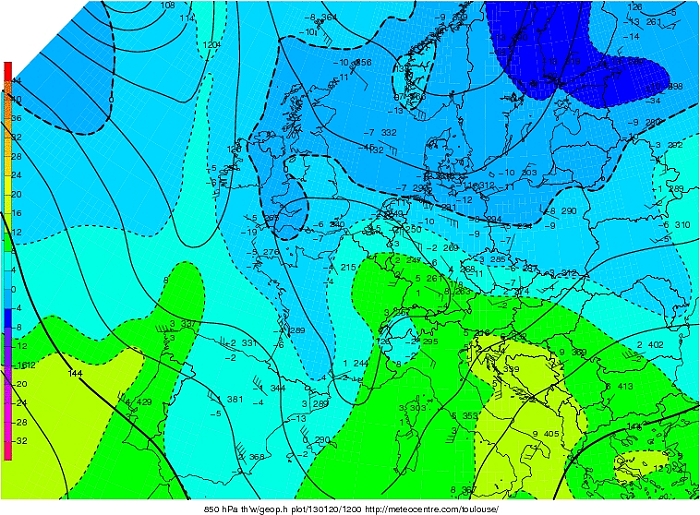
Upper air analysis Theta W 850 hPa of January 20 2013 at 1300 CET. Cold
air with negative values is replaced by milder air on the SE-side
of the depression. (Source chart: Meteocentre.com)
|
 |
|
Loop of forecasted soundings for Brussels of January 20 2013 between
0830-1900 CET. At all levels the temperature remained negative and well
saturated below 500-700 hPa. Also a frontal inversion can be detected
around 850 hPa. (Source: RASP)
|
 |
|
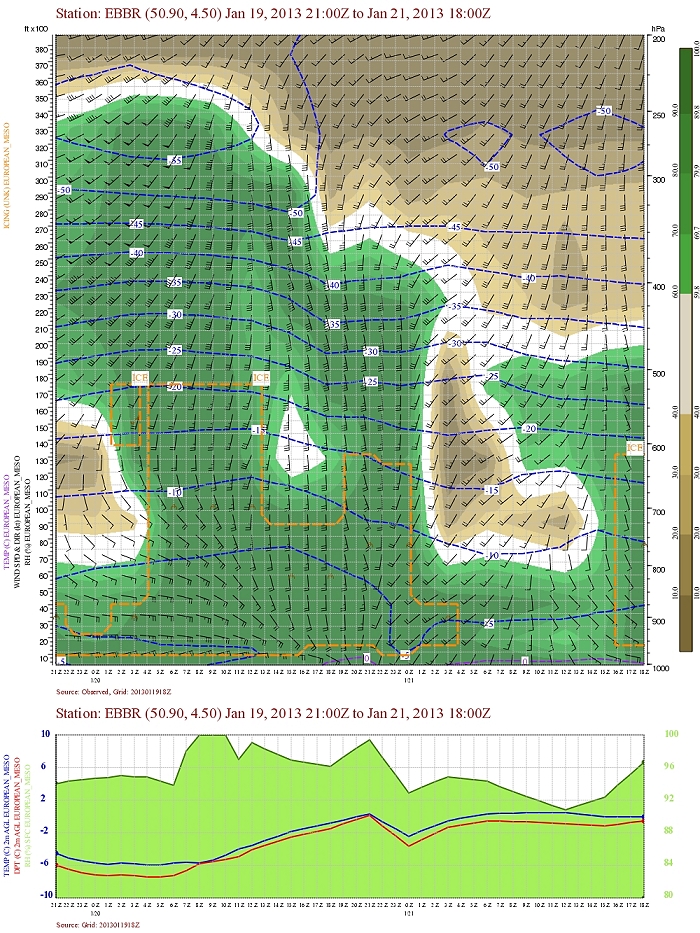
Forecasted vertical profile and surface temperature for Brussels of
January 20 2013 from
2100 UTC (=2200 CET) and the following 48 hours in steps of 1 hour. Legend of upper map: green-brown-white
is humidity in steps of 10% with darkest green being 90% or more, wind
in kt, temperatures each 5°C. During the night of January 19-20, frontal
cloudiness arrived, only clearing 24 hours later. Temperature would
reach briefly 0°C late evening of January 20, but in reality it came
only to -2°C. (Source: Belgocontrol)
|
 |
|
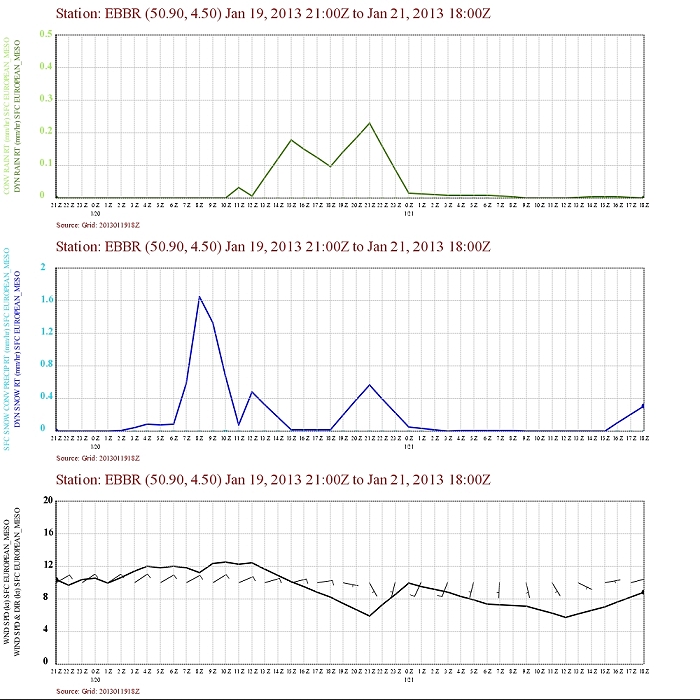
Corresponding precipitation and surface winds. Most intense snow was
forecasted during
the morning of January 20. (Source: Belgocontrol)
|
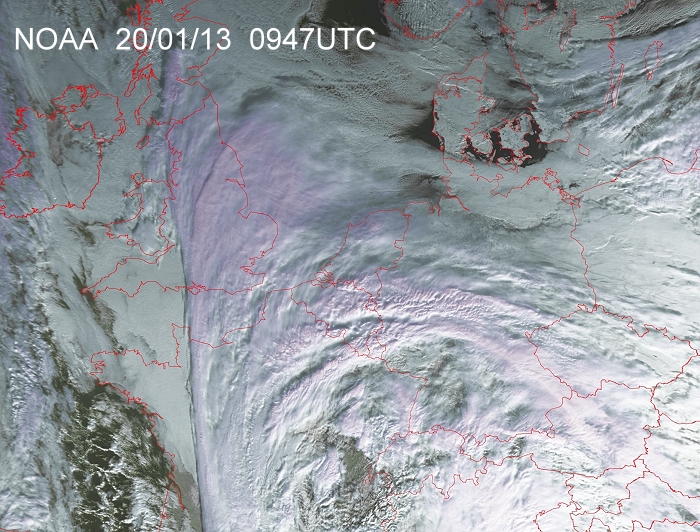 |
| 20/01/2013 0947 CET. Satellite picture
(visual) with frontal cloudiness over entire NW-Europe. (Source sat
picture: NOAA and University of Bern)
|
Radar loop (reflectivity in dBZ) from January 20 2013 0100 CET onwards. Green colors represents moderate snow, blue colors is light snow. (Source radar picture: Belgocontrol).
|
Metars (hours in UTC) of Belgian airport EBBR. Translation: copy paste each obs via
metar-decoder |
 |
|
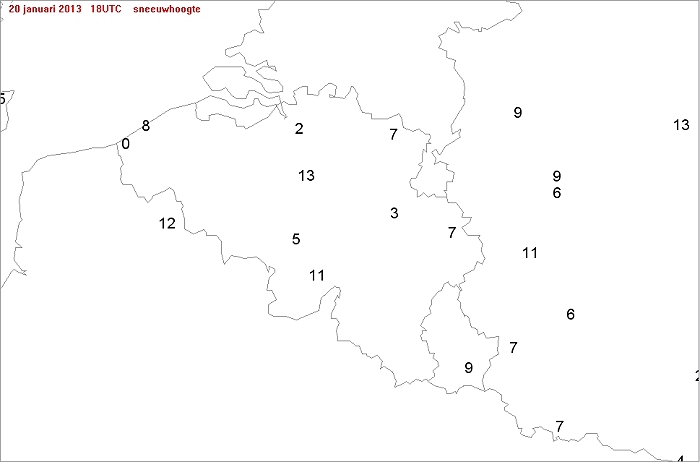
Snow height in cm taken from the synop of 1800 UTC of January 20 2013. Top:
Brussels with 13 cm (but was accumulated on 4 cm
present earlier), followed by Florennes with
11 cm (accumulated on 10 cm earlier present), Kleine Brogel 7 cm (coming
from 5 cm). Foot note: at my location, 5 km from Brussels, only
4 to 5 cm fresh snow (on top of the present 3 cm) was measured, making
the 9 cm fresh snow of Brussels quite doubtful, as other official
stations came with not more then between 2 to 5 cm fresh snow.
|
 |
|
20/01/2013. Temperature histogram in degrees Celcius in local time (CET)
over 24 hrs taken from an automatic station at Kampenhout. Lowest value
-5,4°C in the morning when the most intense snow fell, highest -2,1°C
late evening.
|
 |
|
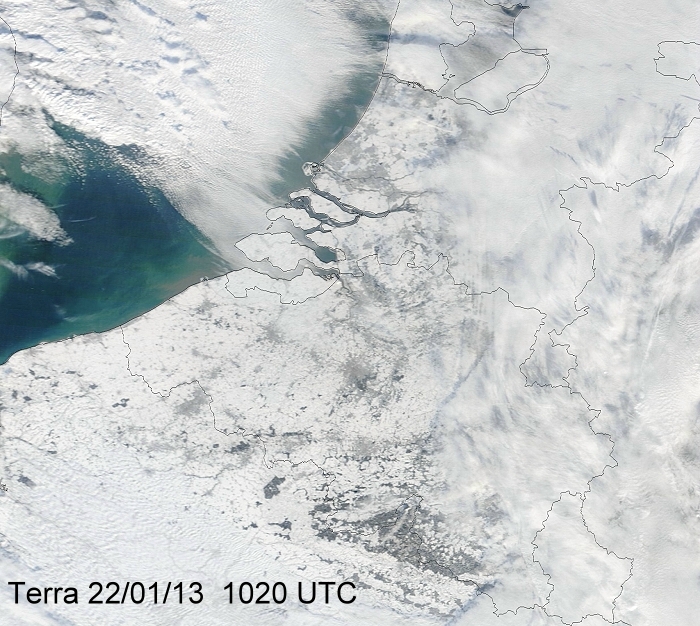
22/01/2013. Two days later, a first glimpse over the Low Countries. A lot of cloudiness over the
east over Benelux, but otherwise a
nice view on the snow cover. (Source: Image courtesy of MODIS Rapid Response Project at
NASA/GSFC)
|
 |
|
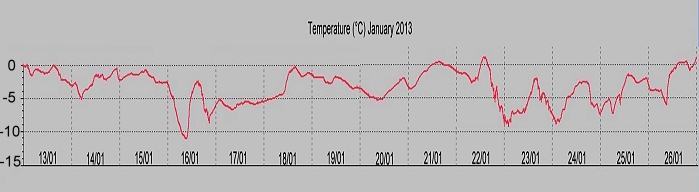
13-26/01/2013. Temperature histogram in degrees Celcius in local time (CET)
over 14 day period from an automatic station at Kampenhout. During the
two week cold wave, the temperature came on two days briefly above 0°C.
|
 |
|
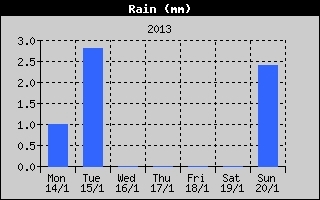
14-20/01/2013. Accumulation of precipitation during the first week of
the cold wave giving maximum 7 cm of snow deposit.
|
 |
|
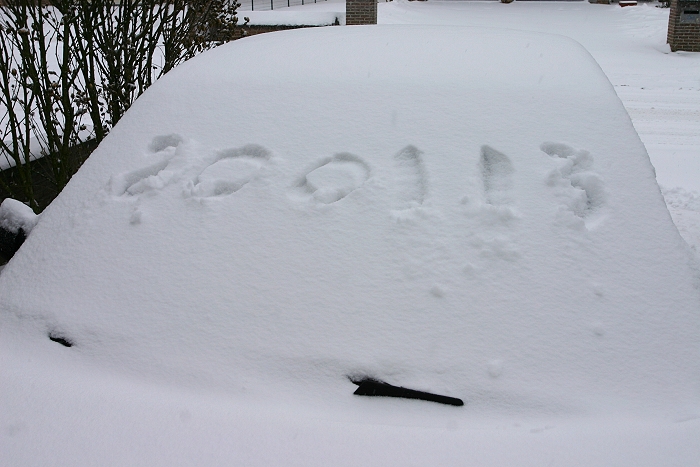
20/01/2013 1303. Proof of the date.
|
 |
|
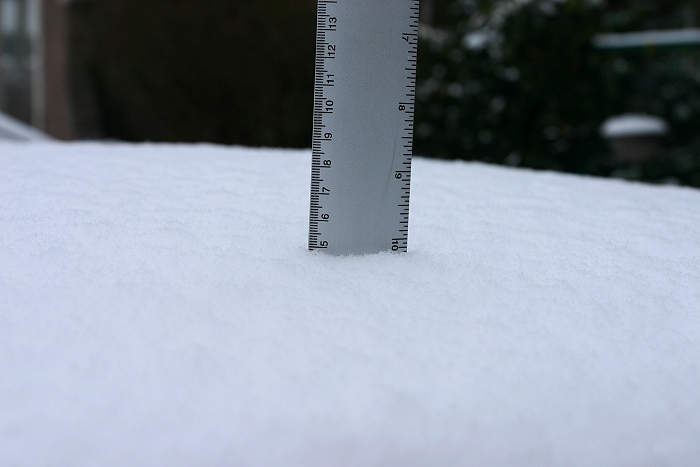
20/01/2013 1553. Proof almost 5 cm of fresh snow on a car.
|
 |
|
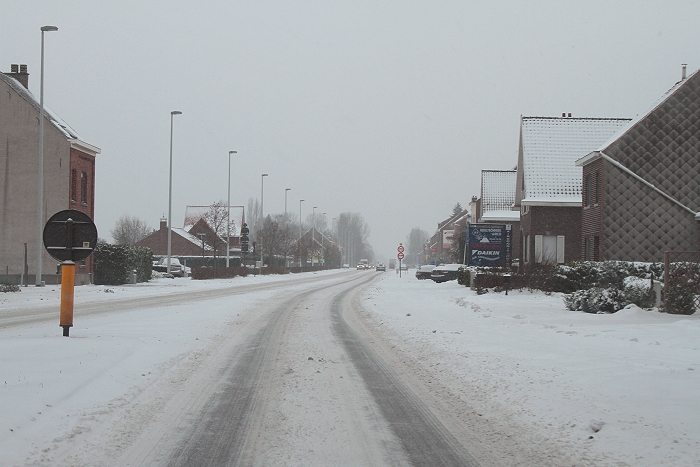
20/01/2013 1240. Main road Haachtsesteenweg covered by snow, not an
every winters sight.
|
 |
|
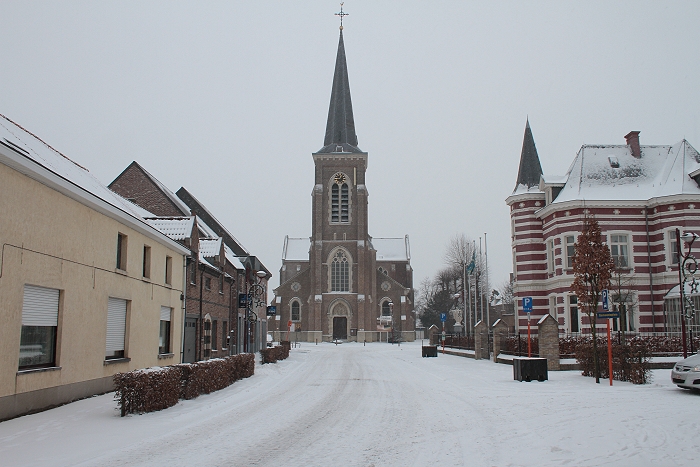
20/01/2013 1245. Centre of Kampenhout.
|
 |
|
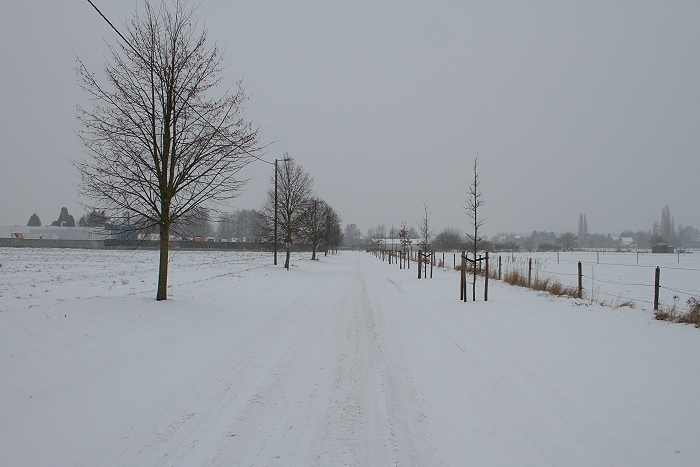
20/01/2013 1251. Secondary road.
|
 |
|
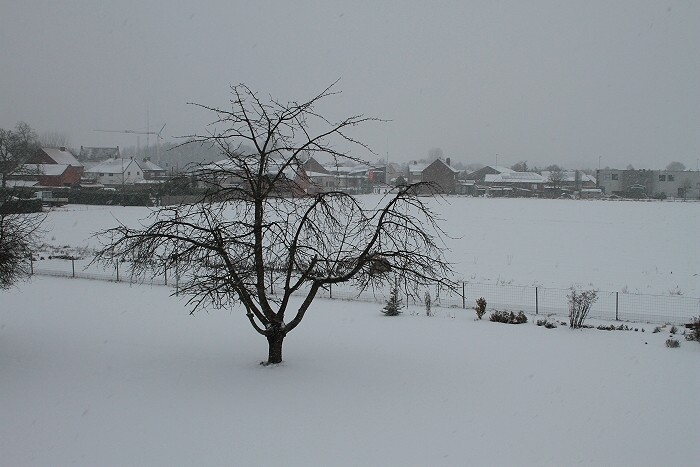
20/01/2013 1431. Gardens view.
|
 |
|
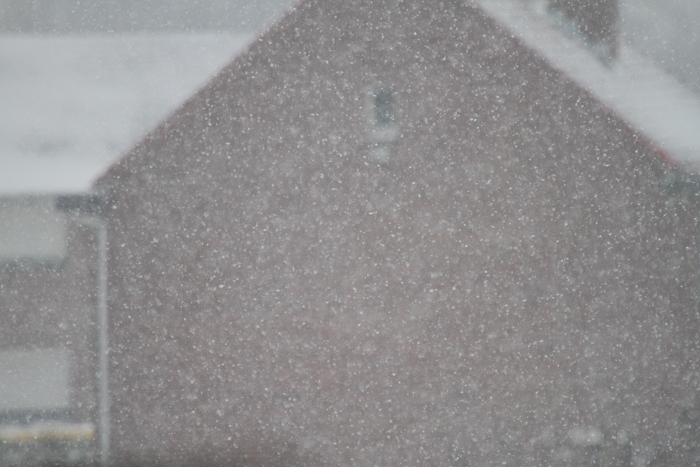
20/01/2013 1433. Last snow of the day, with small snow flakes.
|