| Weather pictures & report of March 23-24 2013 |
| Snow related to an occlusion |
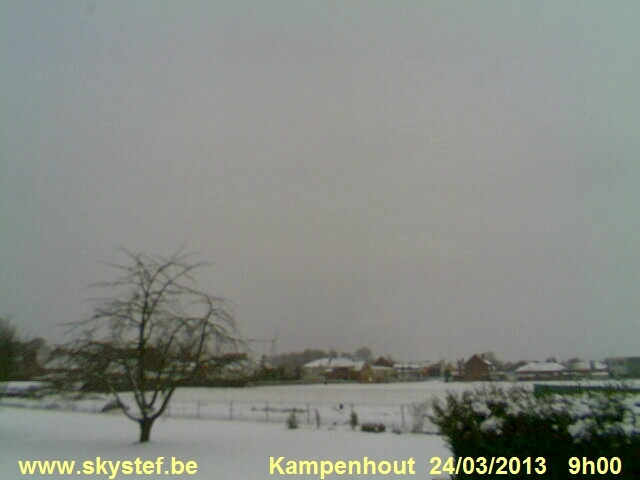
| Synopsis: at 500 hPa a sharpening trough SW of the British Isles was pushing again a ridge over northern Europe. At surface a depression SW was almost stationary with its occluded front slowly moving N-wards over Belgium, but becoming stationary and later in weakened form again moving S-wards. It gave during the night of March 23-24 significant falls of snow from 1 to 8 cm, not seen before so late in the season since 1952. Pictures taken at Kampenhout. Hours in local time (CET). |
 |
|
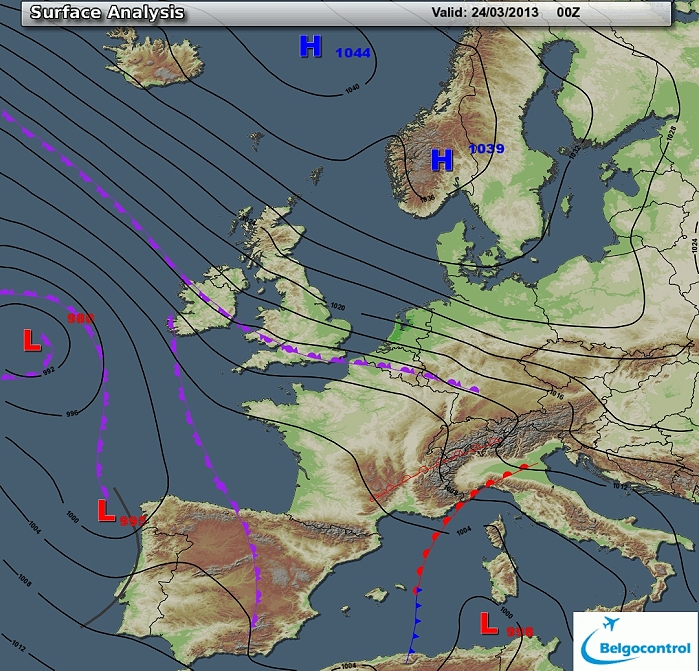
Surface analysis of March 24 2013 at 0100 CET. A persisting high
pressure cell over Scandinavia - Greenland. A depression over the
Atlantic Ocean
was almost stationary, related occlusion moved slightly N-wards. (Source chart: Belgocontrol)
|
|
Loop of 17 surface analyses of each hour of March 23-24 2013
between 1900-1100 CET with the weather plots showing snow falling over the
southern parts of the Low Countries with from late evening onwards negative temperatures. (Source: meteocentre.com)
|
 |
|
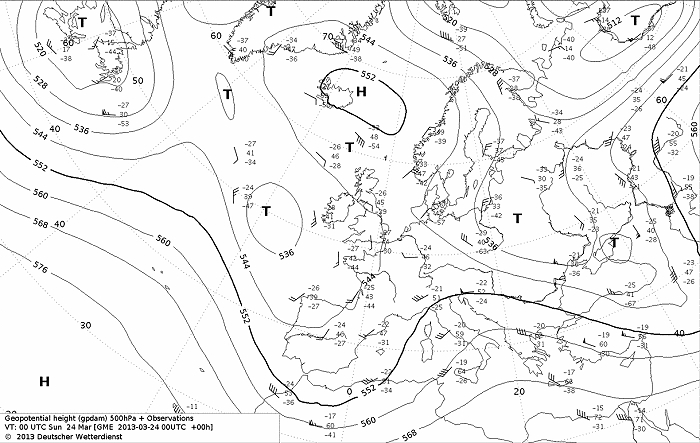
Upper air analysis 500 hPa of March 24 2013 at 0100 CET. High near
Iceland & sharpening
trough west of Eire, resulting the Benelux in a weak S-ly flow. (Source chart: DWD via wetter3)
|
 |
|
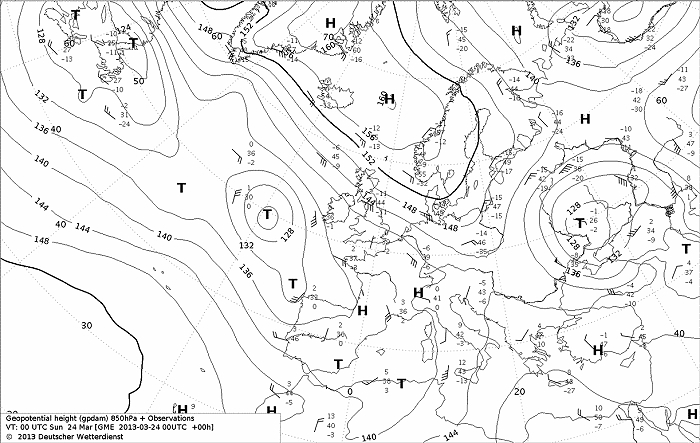
Upper air analysis 850 hPa of March 24 2013 at 0100 CET. Depression
recognizable over SW of Eire moved slowly SE-wards.
Isotherm of -4°C was & remained overhead. (Source chart: DWD via wetter3)
|
 |
|
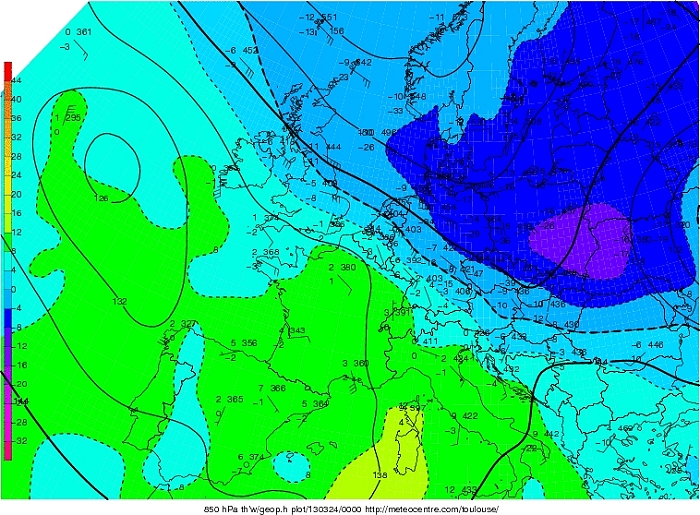
Upper air analysis Theta W 850 hPa of March 24 2013 at 0100 CET. Very
cold air with negative values was present over northern parts of Benelux
moving very slowly S-wards, sucked in by the depression. (Source chart: Meteocentre.com)
|
 |
|
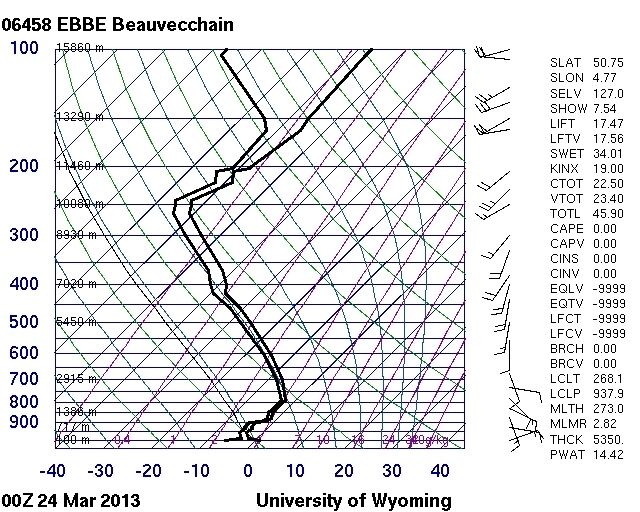
Observed sounding for Beauvechain of March 24 2013 around 0100 CET.
Negative temperatures at all levels with a frontal inversion in the
lower levels and furthermore well saturated till the tropopauze.
(Source: http://weather.uwyo.edu/upperair/europe.html)
|
|
Loop of 9 forecasted soundings each 3 hour of March 23-24 2013
from 1600 CET onwards for Brussels Airport. Except temporary in the bottom
layer, the temperature remained (just) negative on passage of the
precipitation which stayed under solid form.(Source: weatheronline.co.uk )
|
 |
|
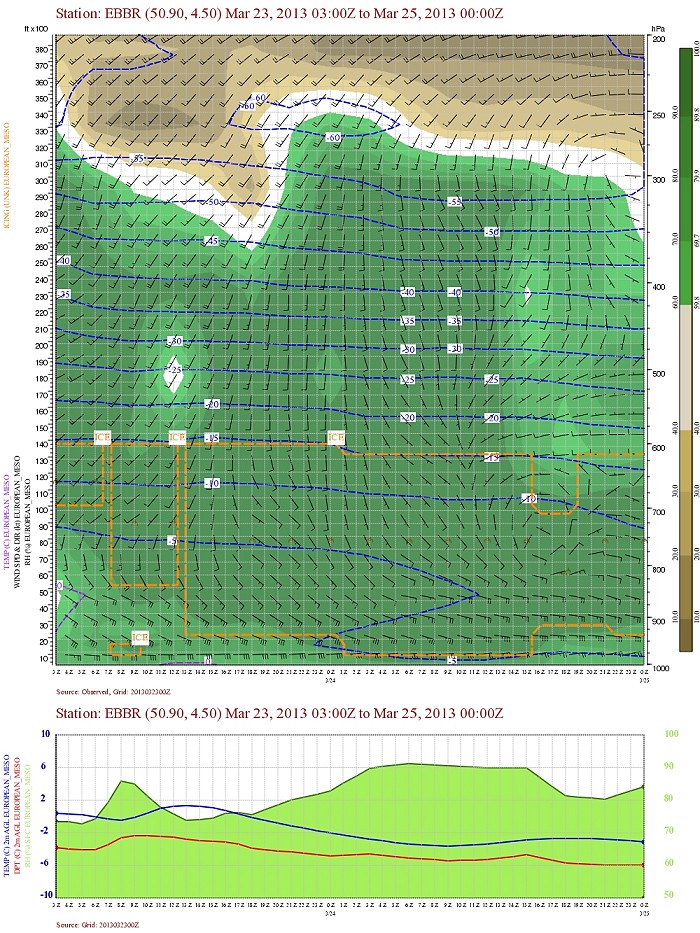
Forecasted vertical profile and surface temperature for Brussels of
March 23 2013 from
0400 UTC (=0500 CET) and the following 48 hours in steps of 1 hour. Legend of upper map: green-brown-white
is humidity in steps of 10% with darkest green being 90% or more, wind
in kt, temperatures each 5°C. By the morning of March 23, the frontal
cloudiness arrived and would clear 36 hours later. Temperature became
slightly higher (even above 0°C) in afternoon of March 24. (Source: Belgocontrol)
|
 |
|
Corresponding precipitation. During the night of March 23-24 wintry
precipitation would fall but in reality it was compressed around midnight and a couple of hours
afterwards. (Source: Belgocontrol)
|
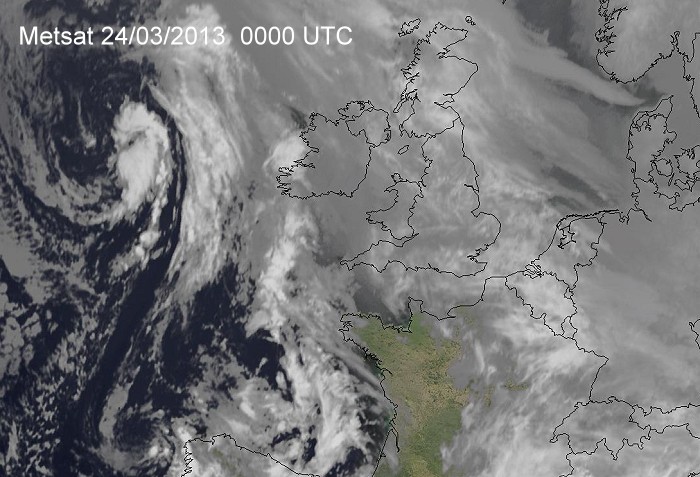 |
| 24/03/2013 0100 CET. Satellite picture
(infrared) but with color. Frontal cloudiness over France - Benelux and
United Kingdom.
Recognizable is also a vortex SW of Eire.
Source picture: Eumetsat
|
Radar loop (reflectivity in dBZ) from March 23-24 2013 from 1800 CET onwards. Green to yellow colors represents moderate snow, blue colors is light snow. (Source radar picture: Belgocontrol).
|
Metars (hours in UTC) of Belgian airport EBBR. Translation: copy paste each obs via
metar-decoder
|
 |
|
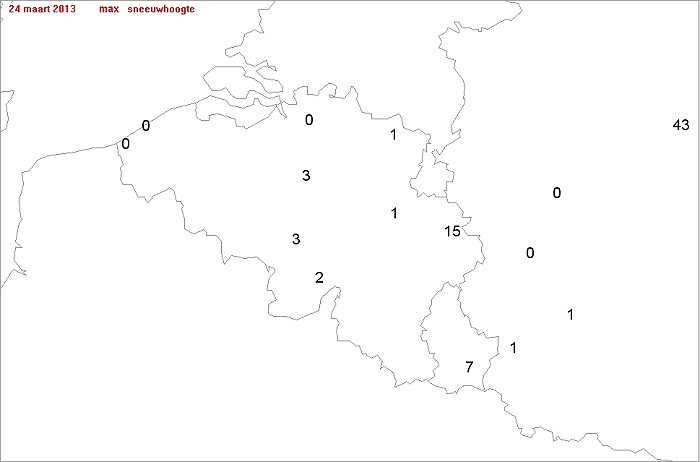
Maximum snow height in cm taken from the synops of 0600 thru 2100 UTC of March 24 2013. Top: Mont Rigi with 15 cm (came from 5 cm already present
earlier) followed by Steenokkerzeel & Charleroi with 3 cm. At my location, 5 km from Zaventem,
up to 4 cm was measured, although the strong winds led to formation of
small dunes as well.
|
 |
|
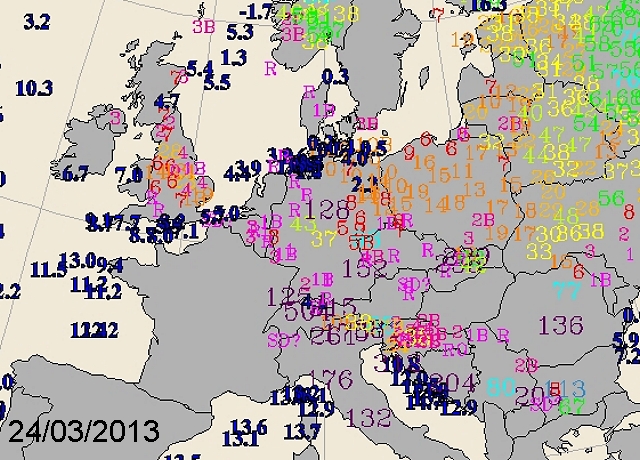
24/03/2013. Snow coverage over Europe. The British Isles had even more
severe winter weather. (Source: Uni-Koeln)
|
 |
|
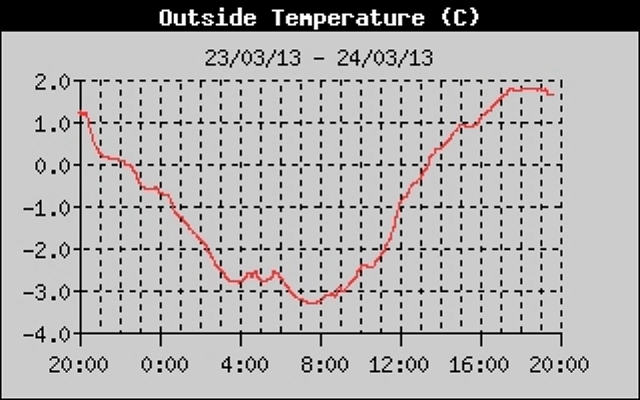
23-24/03/2013. Temperature histogram in degrees Celcius in local time (CET)
over 24 hrs taken from an automatic station at Kampenhout. Lowest value
-3,3°C in the morning, highest +1,8°C by the evening.
|
 |
|
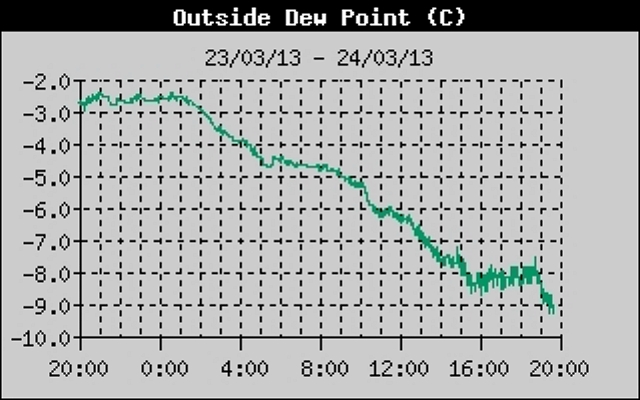
23-24/03/2013. Dewpoint temperature histogram in degrees Celcius in local time (CET)
over 24 hrs taken from an automatic station at Kampenhout. Clearly a
descending trend during Match 24.
|
 |
|
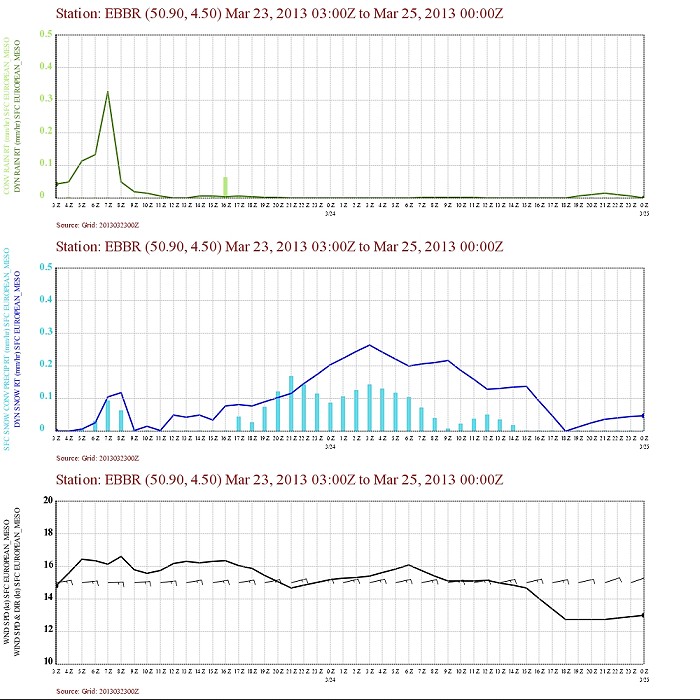
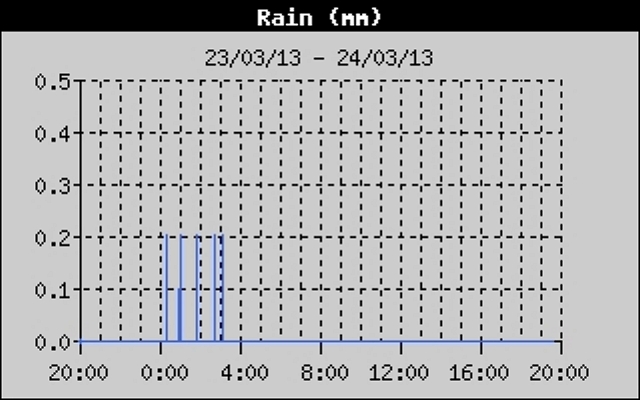
23-24/03/2013. From the auto station: most snow fell between 0000-0300
CET.
|
 |
|
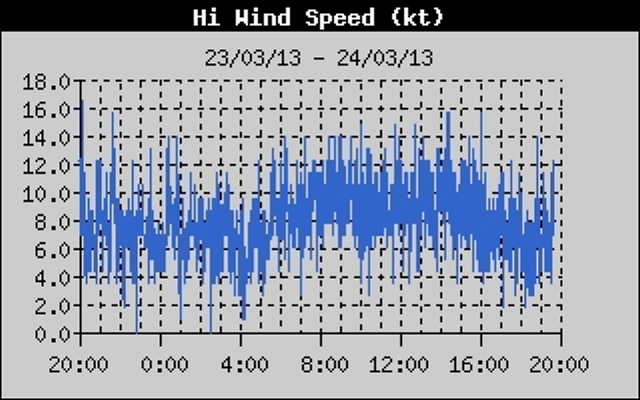
23-24/03/2013. From the auto station: moderate winds up to 16 kt, but
during the snow it was a bit less so that precipitation could be
detected in the rain collector.
|
 |
|
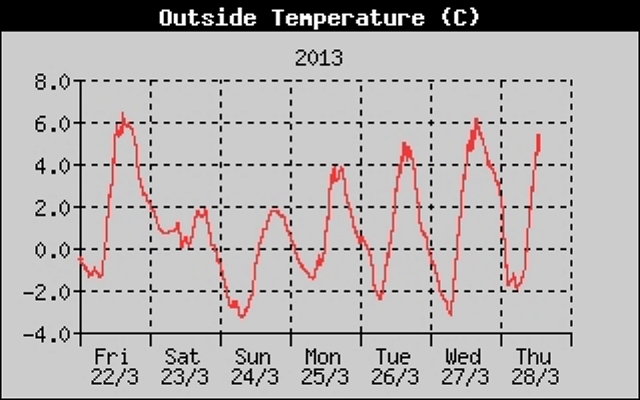
22-28/03/2013. Temperature histogram in degrees Celcius in local time (CET)
over 7 days taken from an automatic station at Kampenhout. Rather cold
period with every night subzero temperatures.
|
 |
|
24/03/2013. Late snow on my weather webcam was witnessed by >150 people
worldwide, 5x the normal average.
|
 |
|
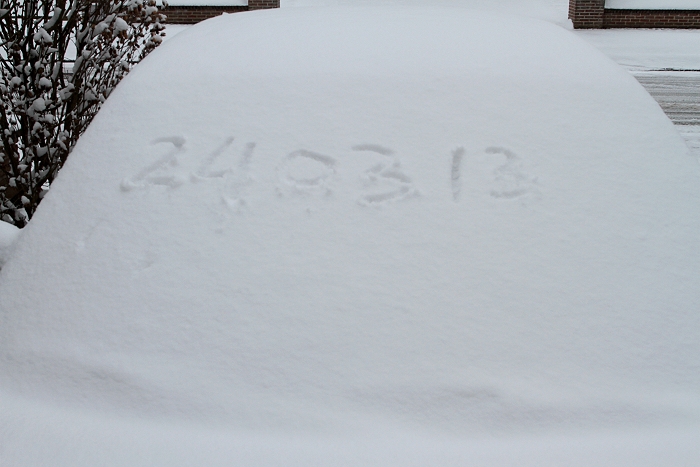
24/03/2013 0924. Proof of the date the morning after the nightly
snowfall.
|
 |
|
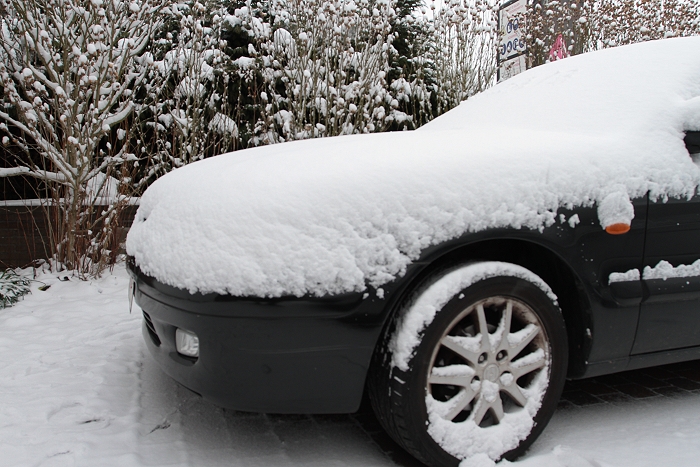
24/03/2013 0925. The car covered under a thick snow carpet up to 10 cm, bit
exaggerated due to the winds blowing from the plants side.
|
 |
|
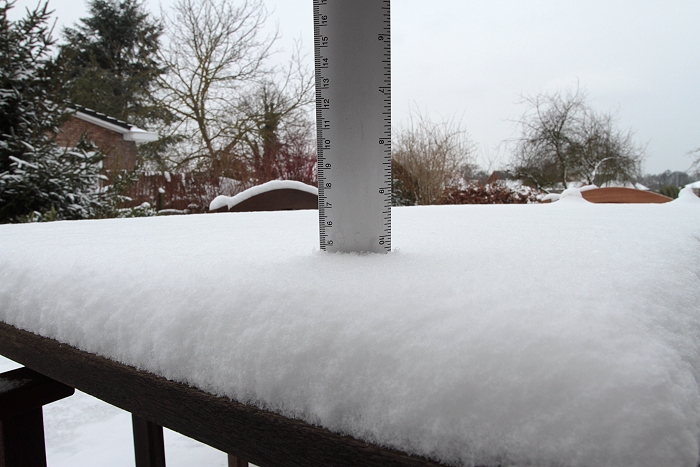
24/03/2013 0932. On the table up to 4 cm was measured.
|
 |
|
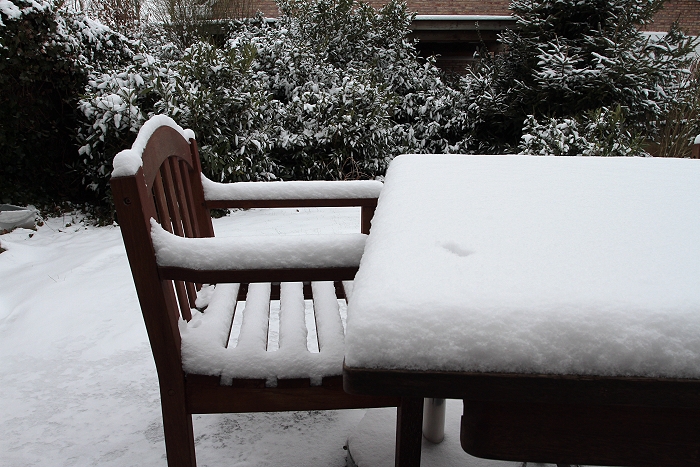
24/03/2013 0935.
|
 |
|
24/03/2013 0930. View into the garden.
|
 |
|
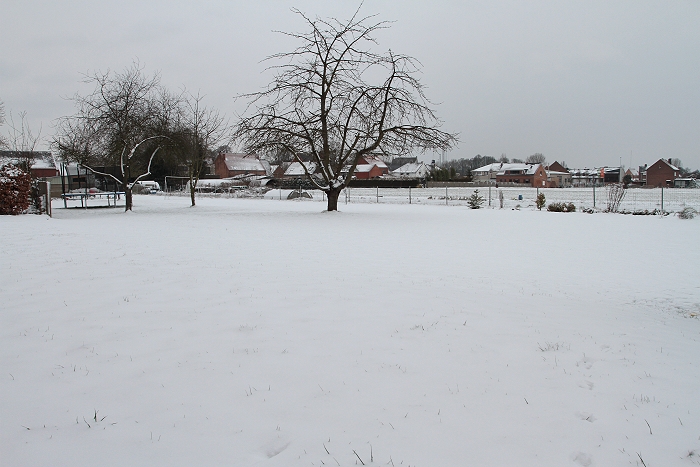
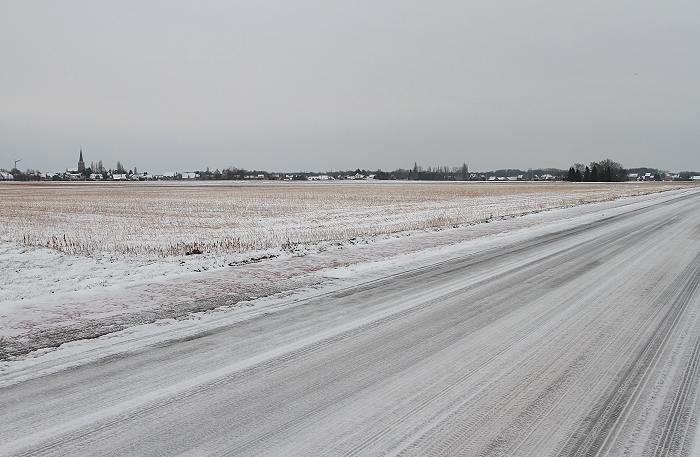
24/03/2013 1011. Small sight seeing tour in Kampenhout.
|
 |
|
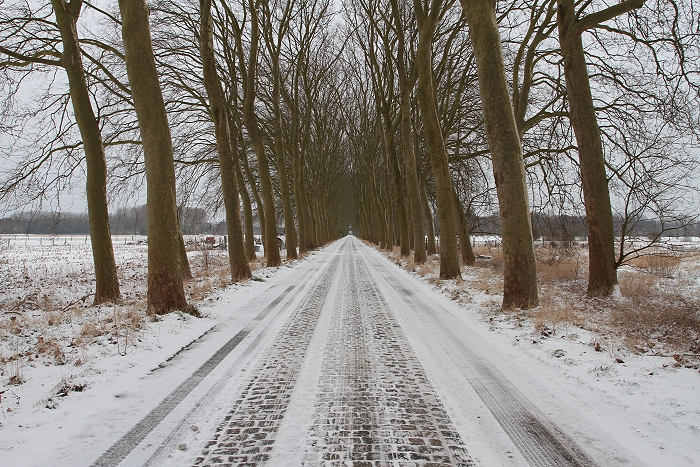
24/03/2013 1016.
|
 |
|
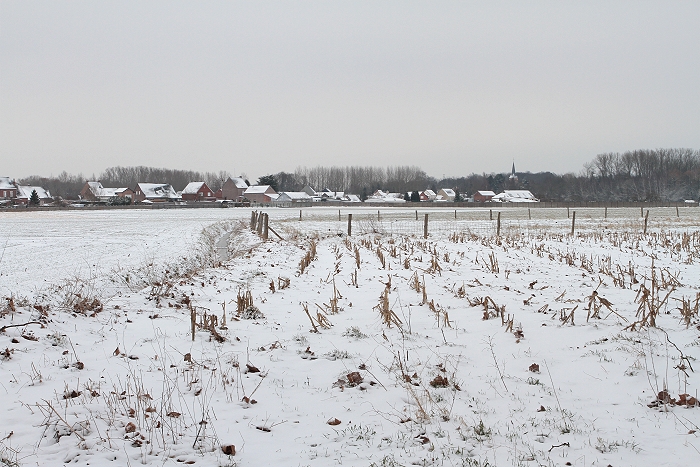
24/03/2013 1025.
|
 |
|
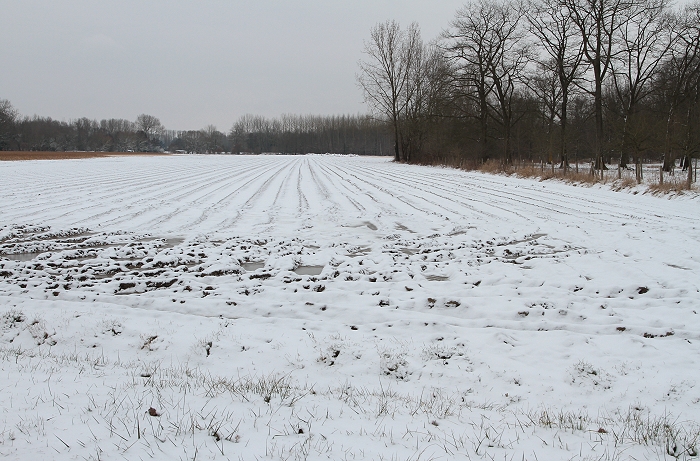
24/03/2013 1115. No sun was detected, it came out two days later when
the snow on the ground was almost gone. Final traces disappeared on
March 28.
|