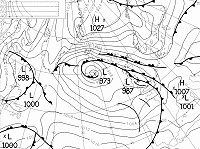
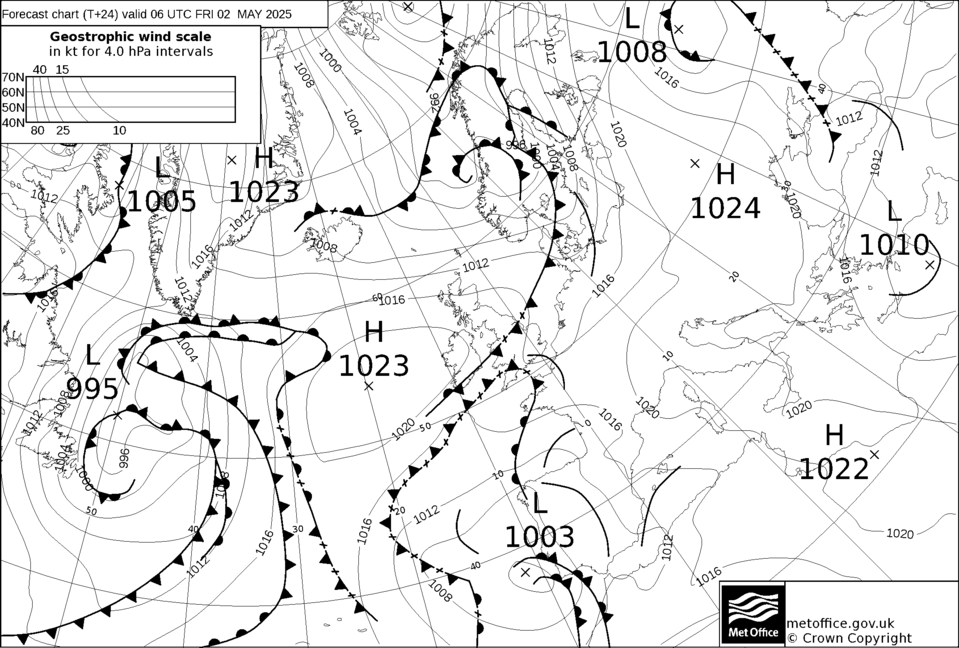
| Legend Solid line + values = mean sea level pressure isobars each 4 hPa
(hectopascal).
Dashed line + values = thickness 1000-500 hPa each 18 gpdam (geopotential
decameter).
Thick solid line with wedges = cold front moving in the direction of
pointing.
Thick solid line with semicircles = warm front moving in the direction of
pointing.
Thick solid line with wedges and semicircles = occluded front or
occlusion moving in the direction of pointing.
Thick solid line = trough and convergence line.
H = high pressure (with '' x '' as center).
L = low pressure (with '' x '' as center).
Useful for: combination thickness and mean sea level pressure will show
areas experiencing advection of cold air (CAA) with low thickness values
or advection of warm air (WAA) with high thickness values. This has effect
on the low level temperatures which will increase in WAA and decrease in
CAA. Certain thickness values mark air masses eventually separated by
fronts: 570 tropical air, 546 = polar front, 510 arctic front.
Useful for: thickness give indication on type of precipitation
(wintry or not). See further on maps "forecasting snow via
thickness".
Useful for: prognoses for wind speed (tight isobars = rather windy),
direction = clock wise around high pressure and anti clock wise around low
pressure, and general type of weather (rather poor in a low, and fair in a
high).
|