SkyStef's weather page
|
|
SkyStef's weather page |
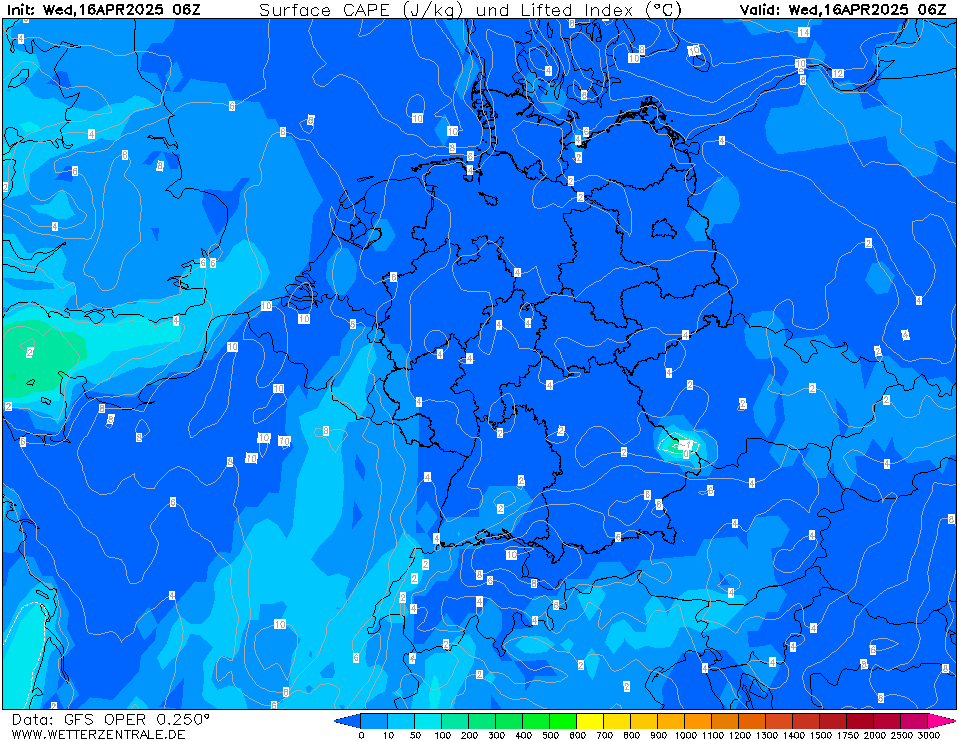
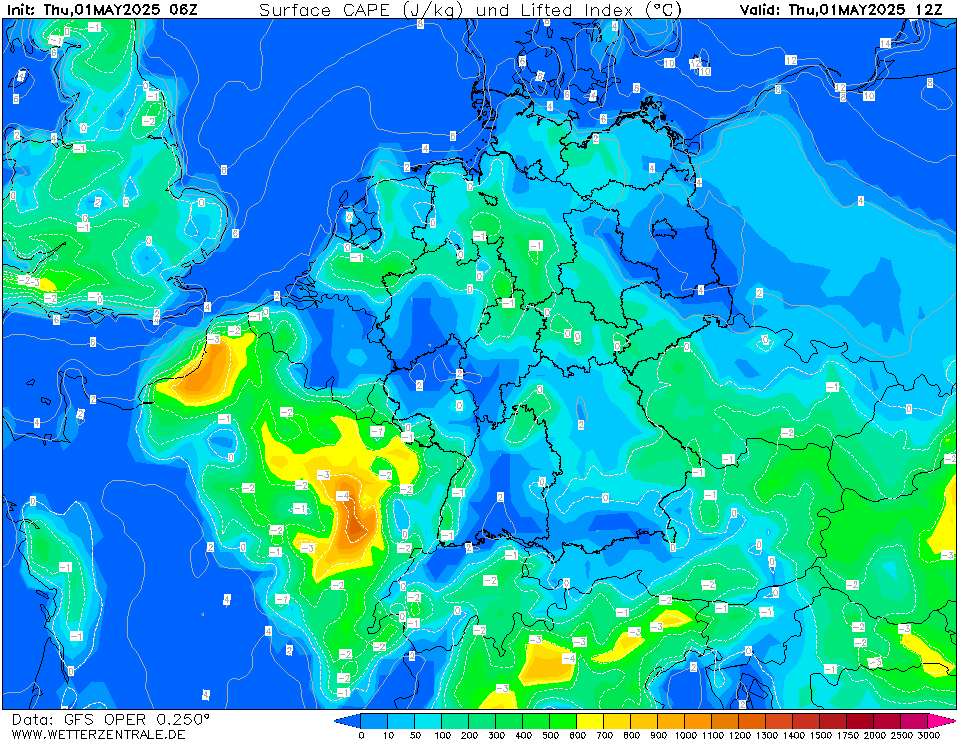
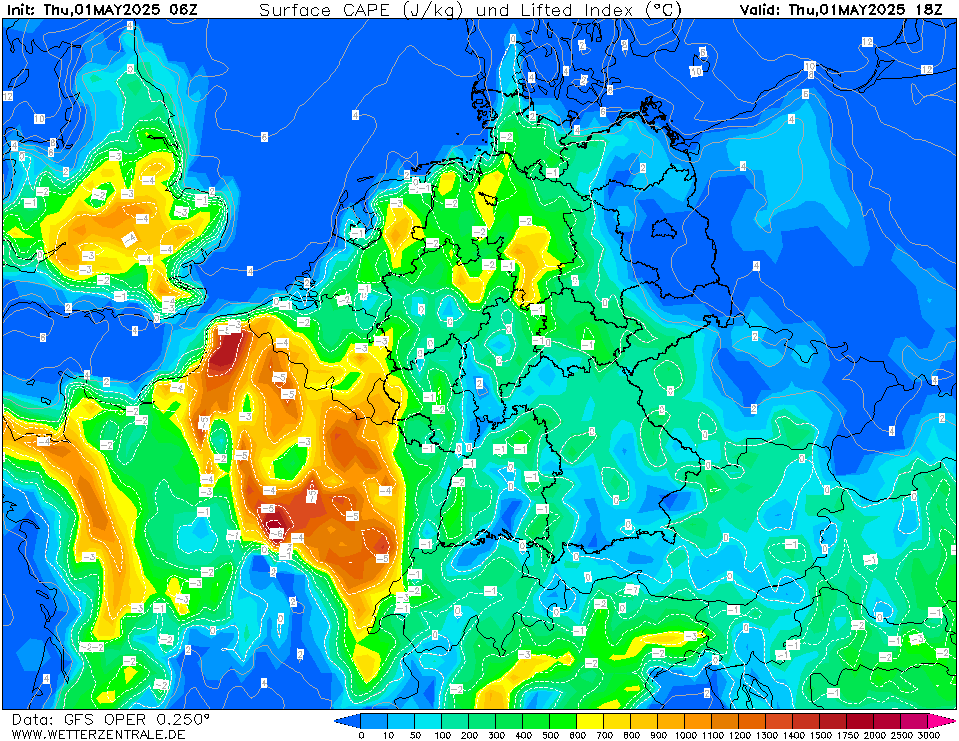
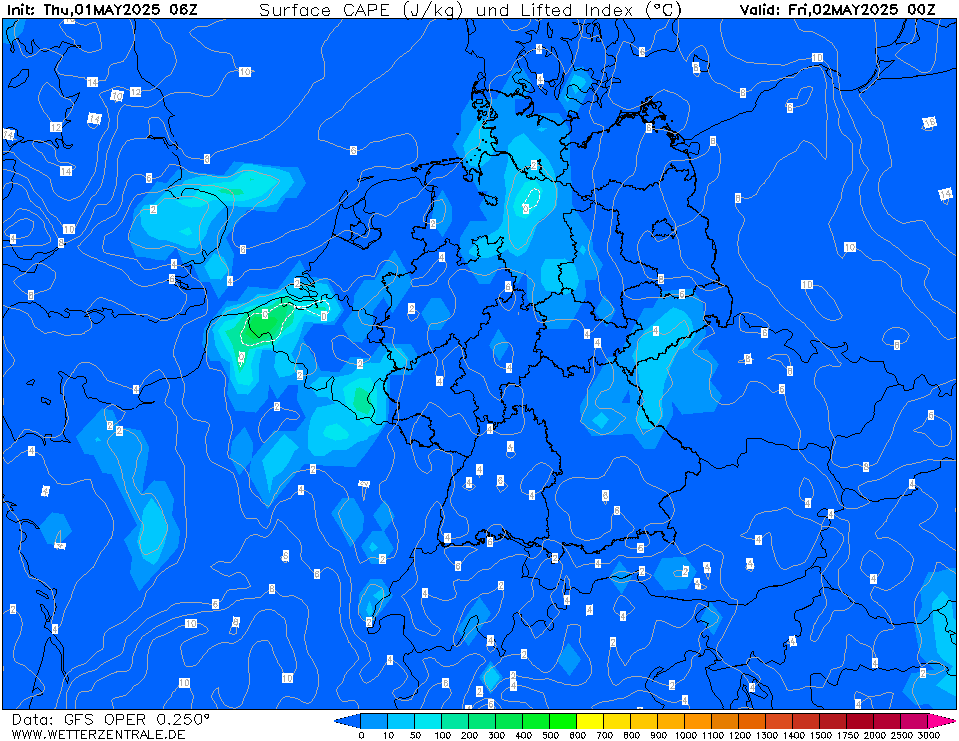
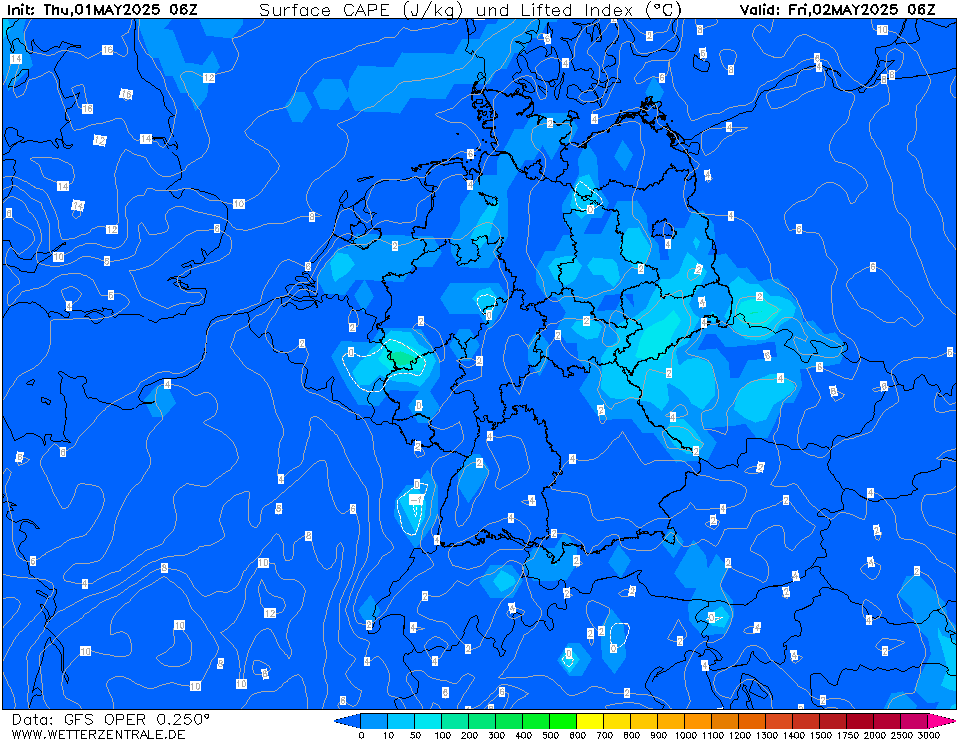
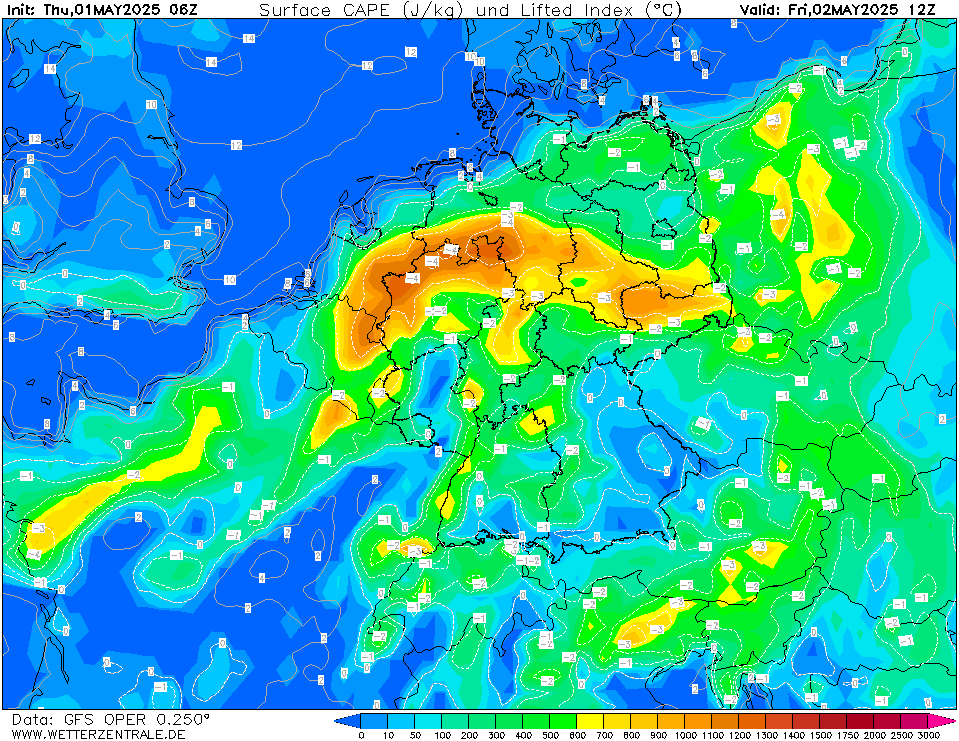
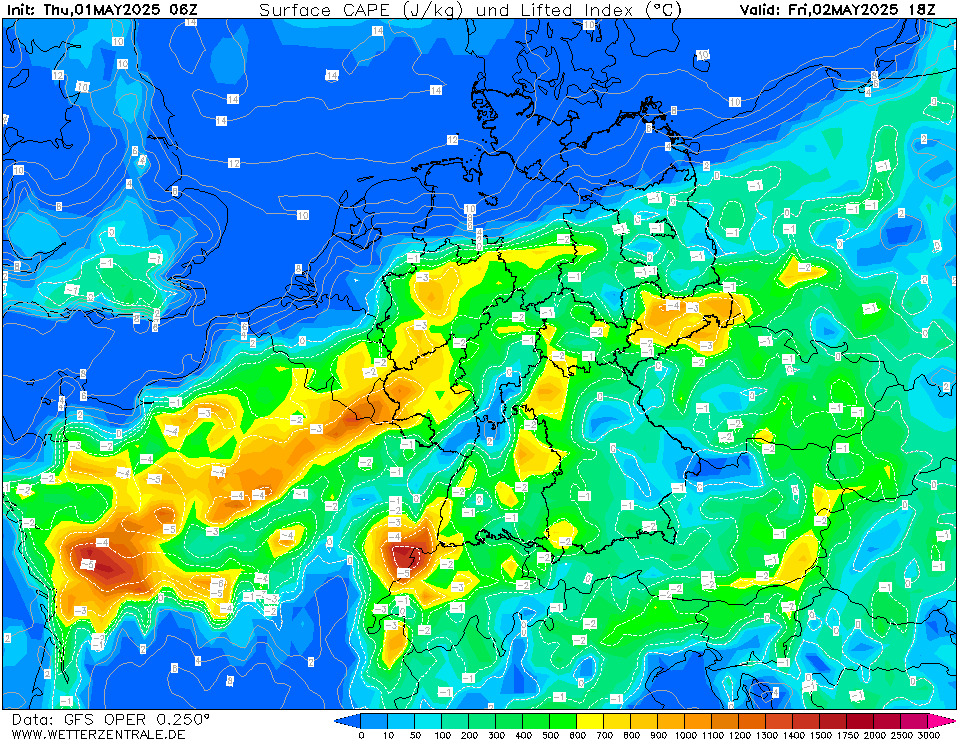
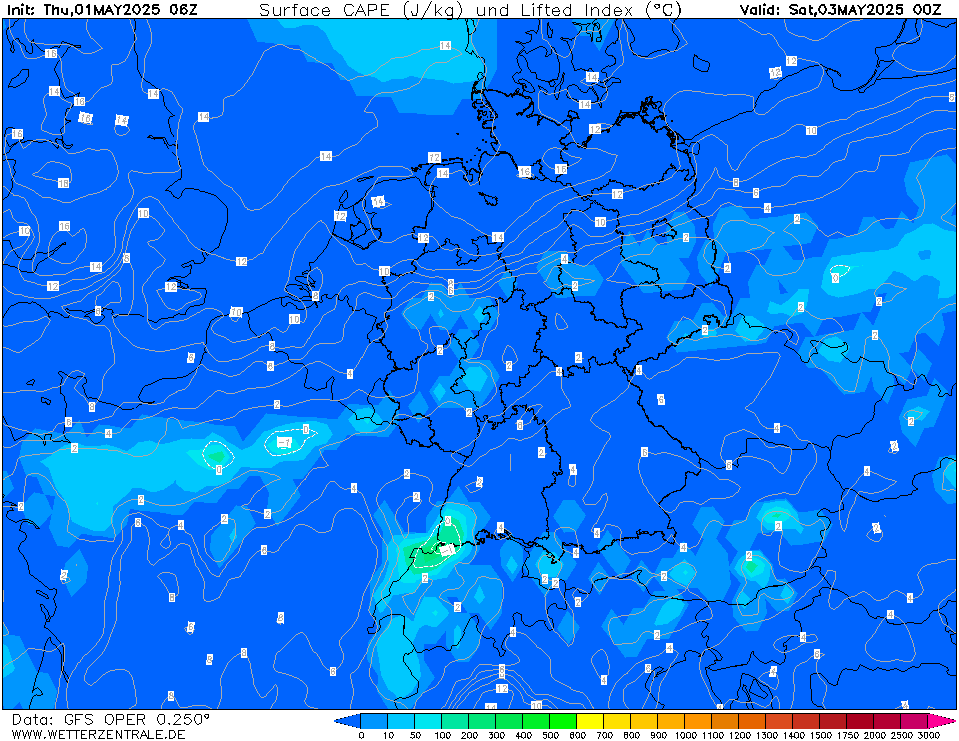
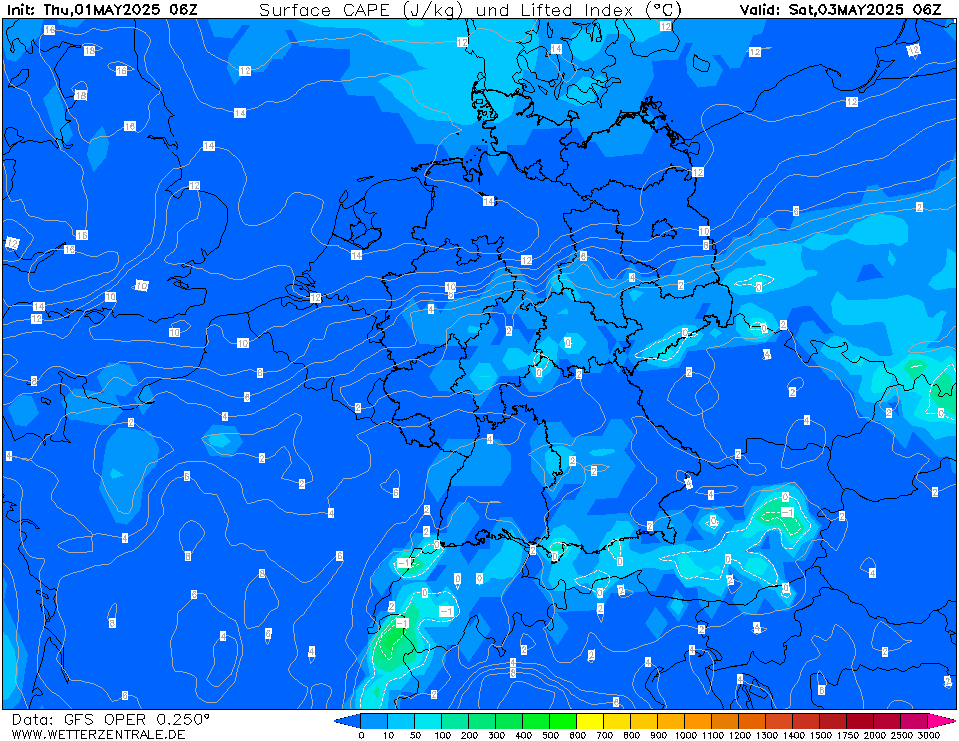
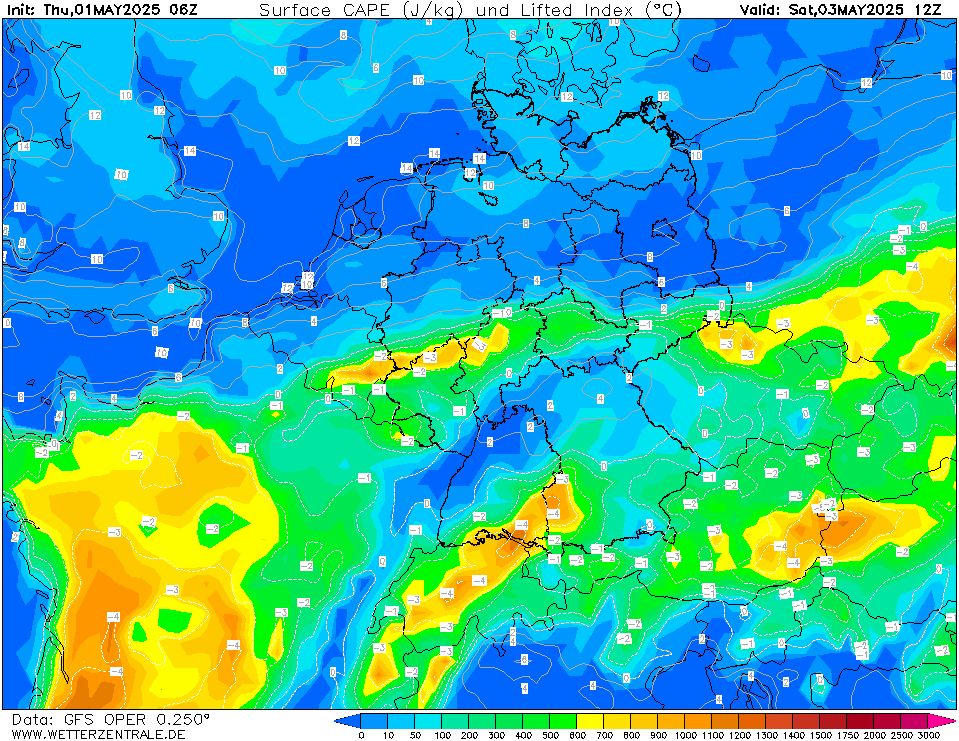
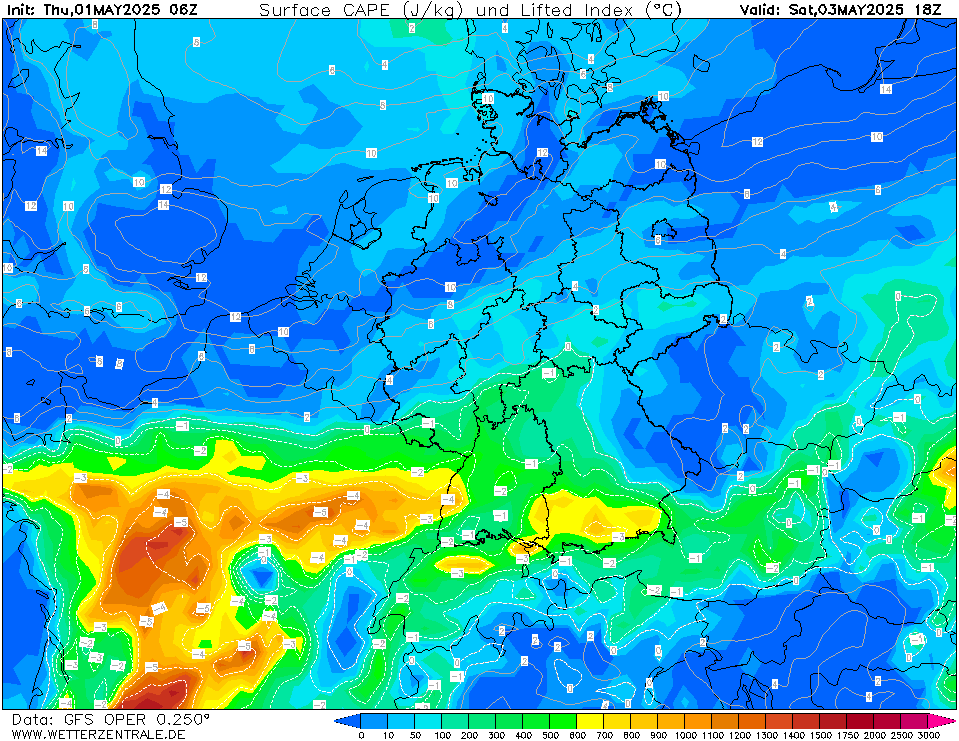
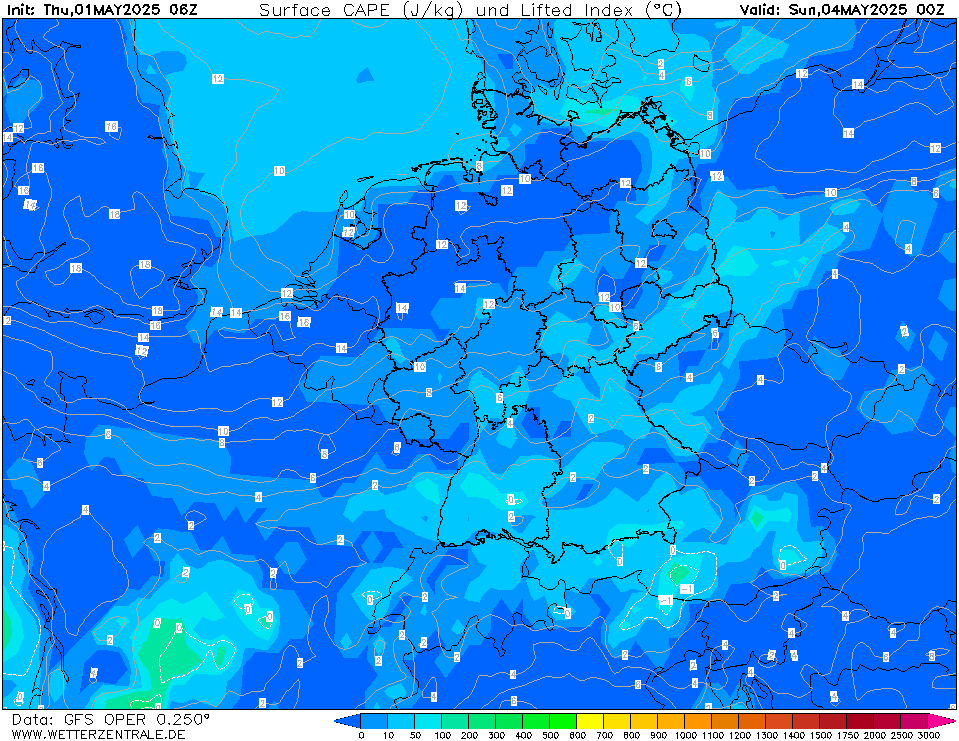
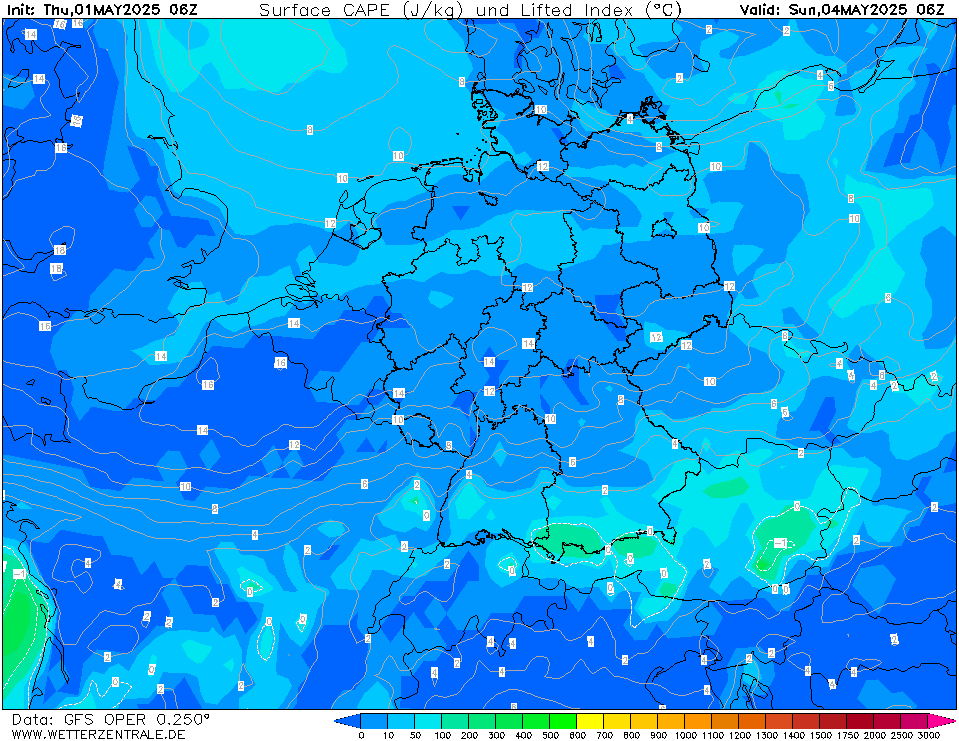
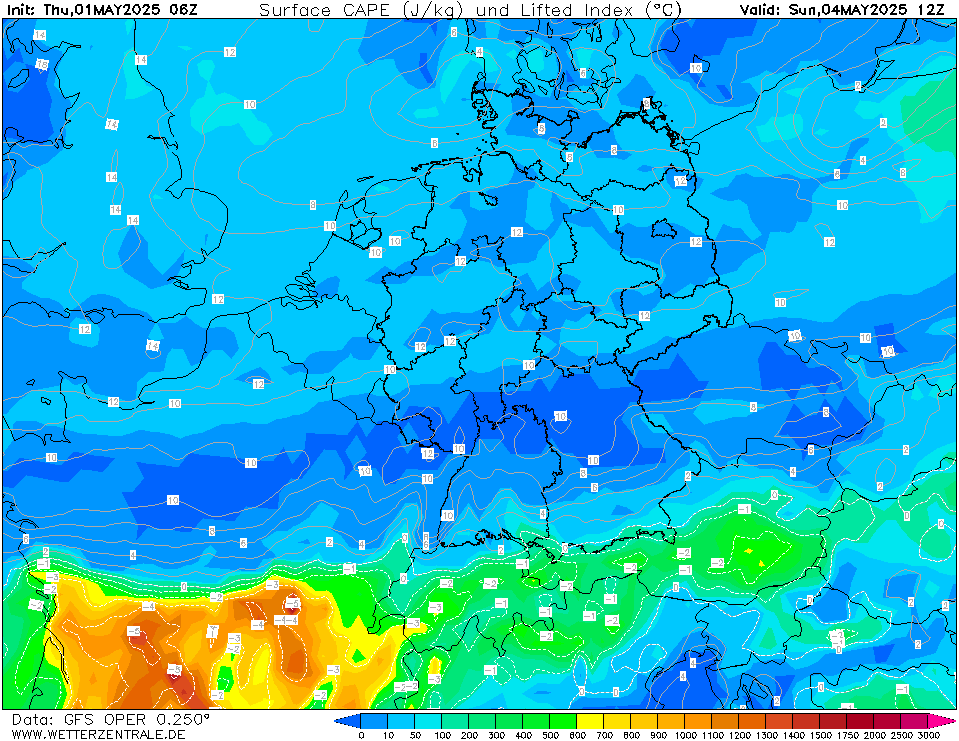
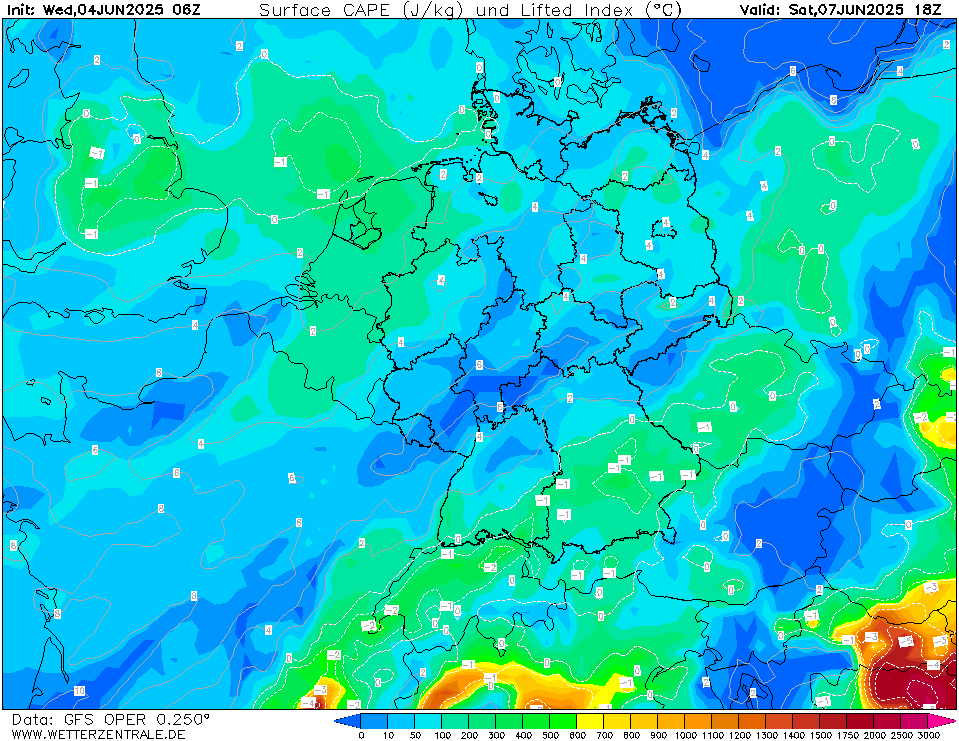
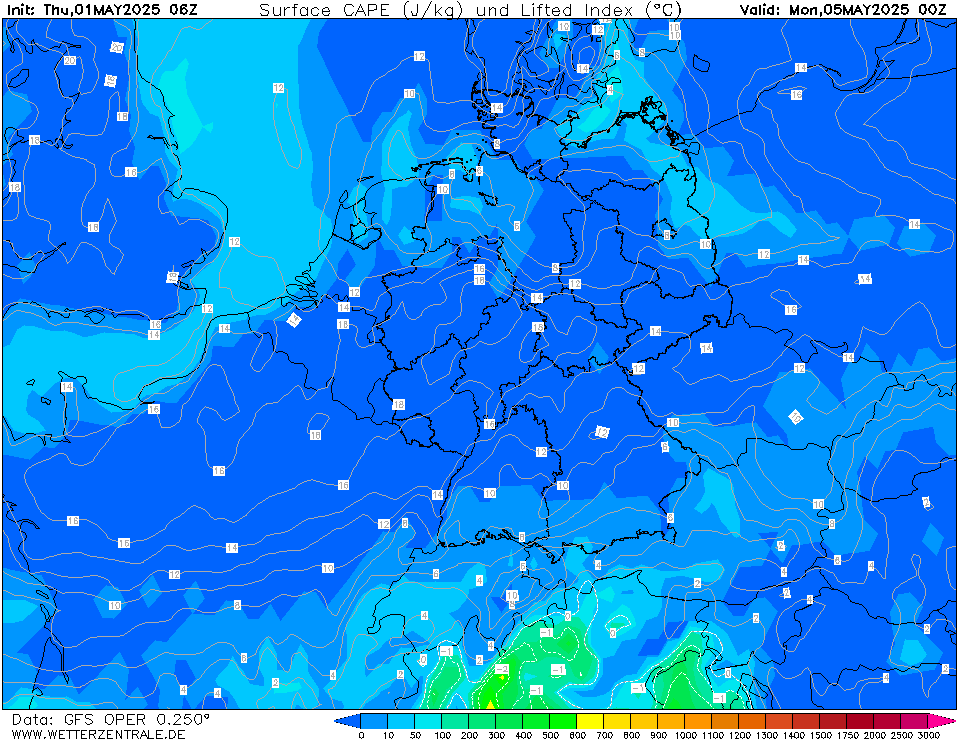
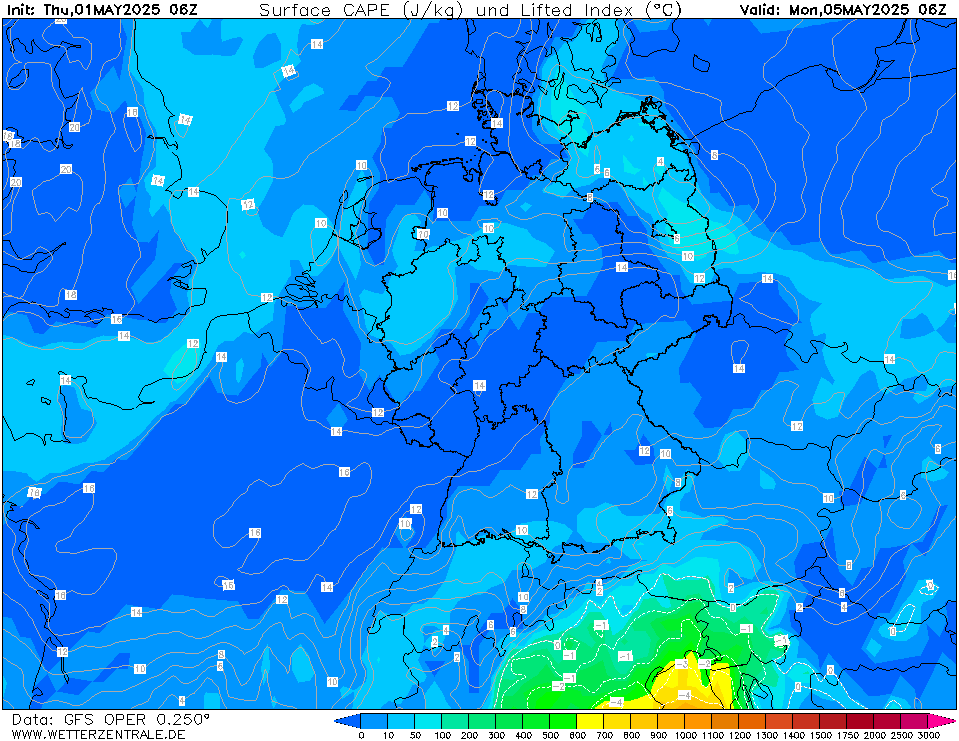
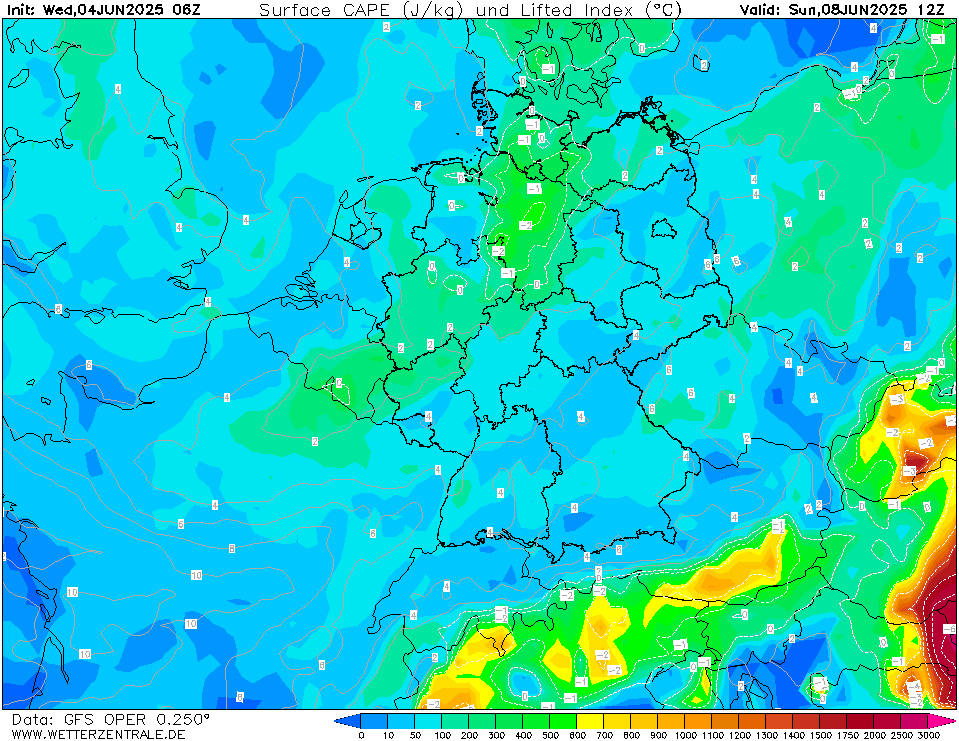
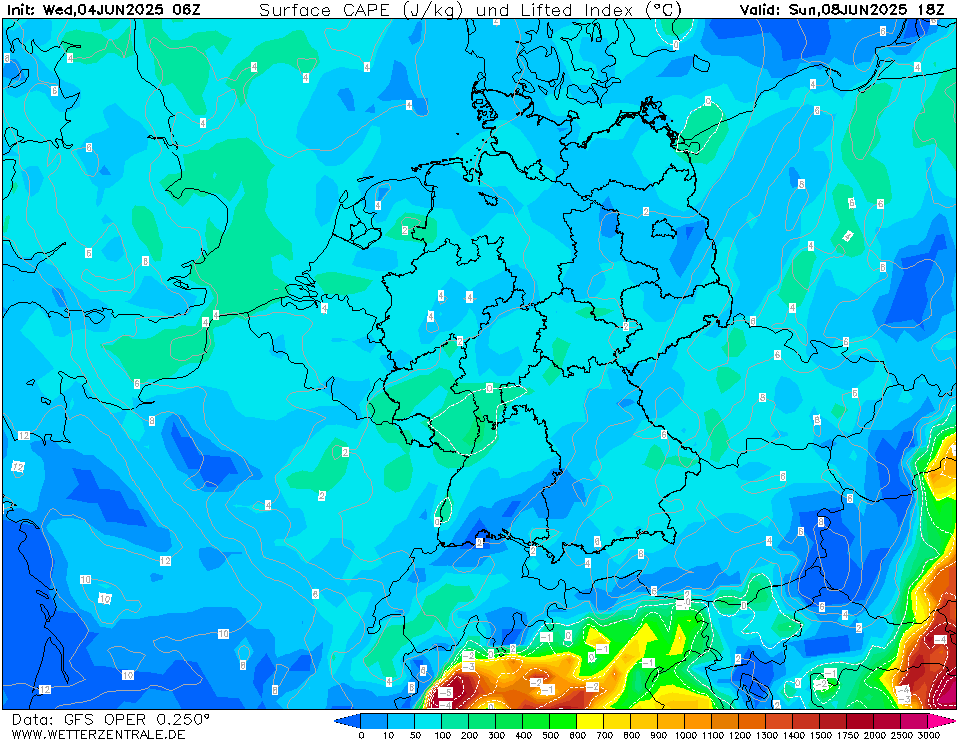
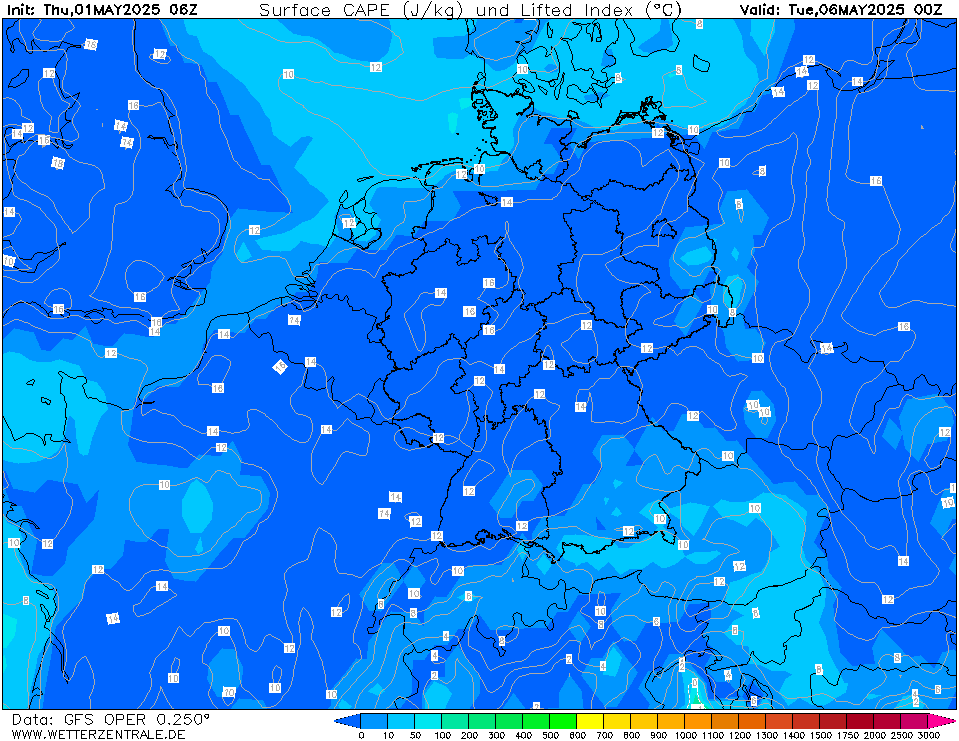
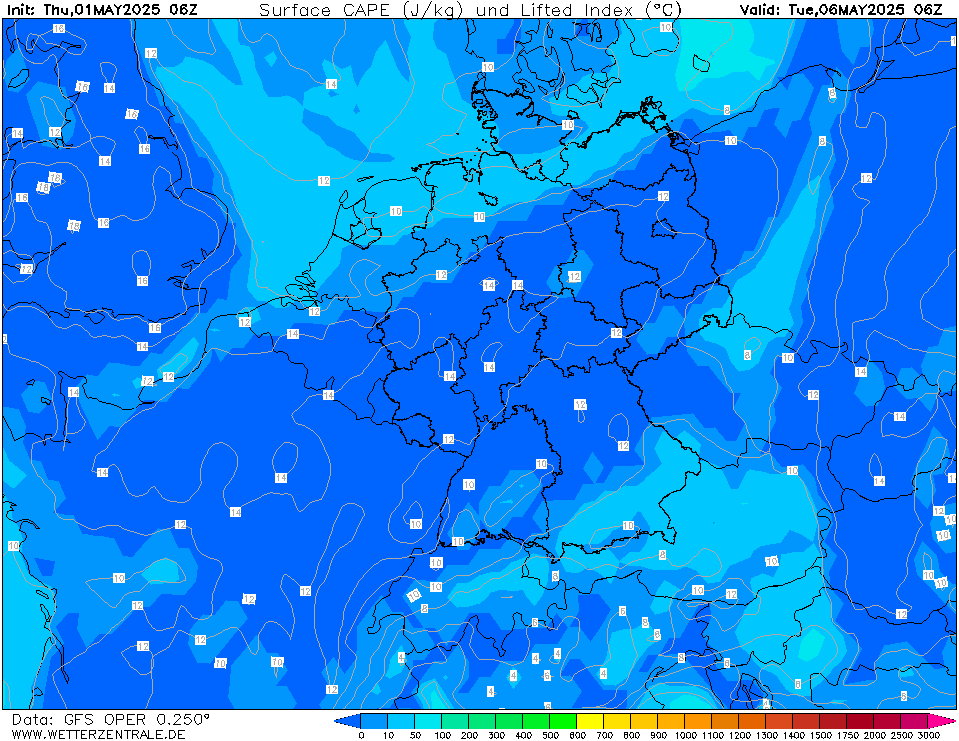
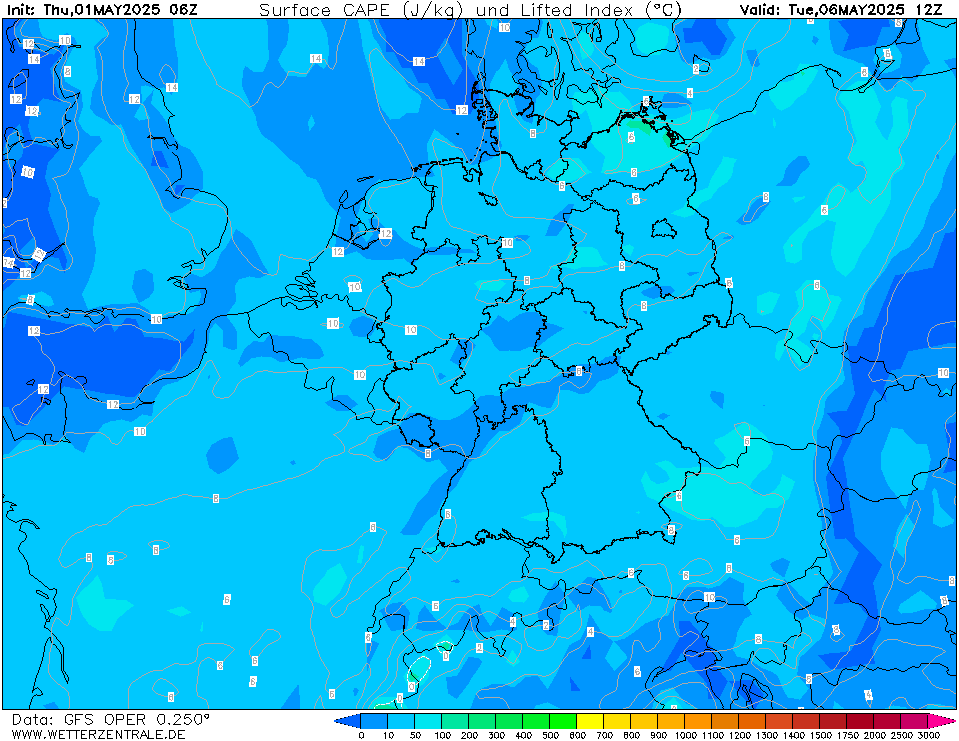
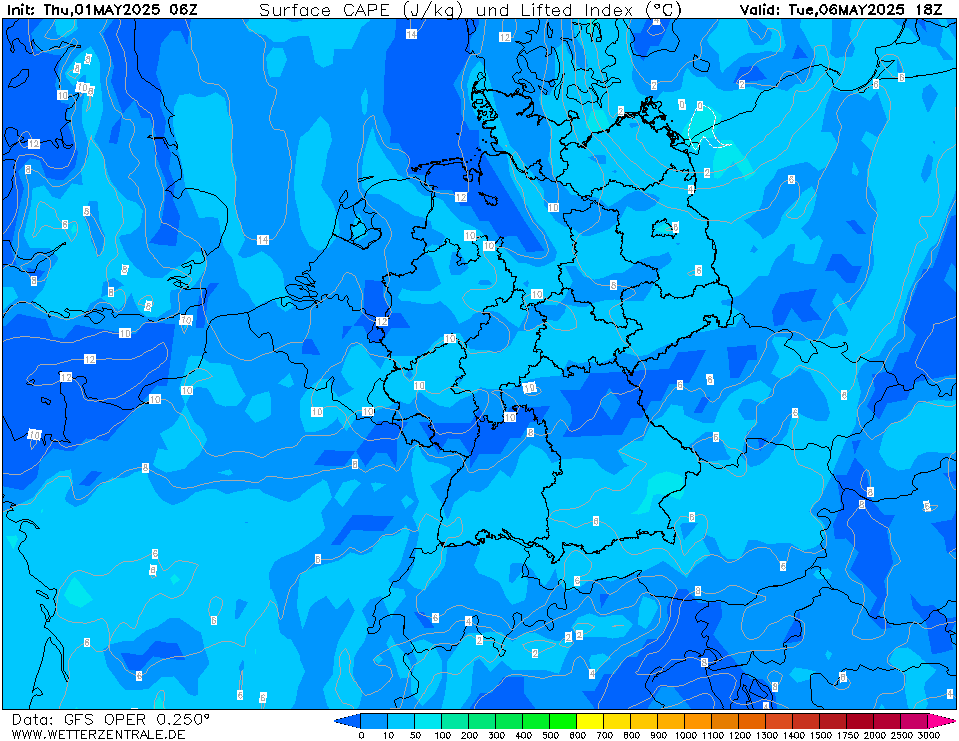
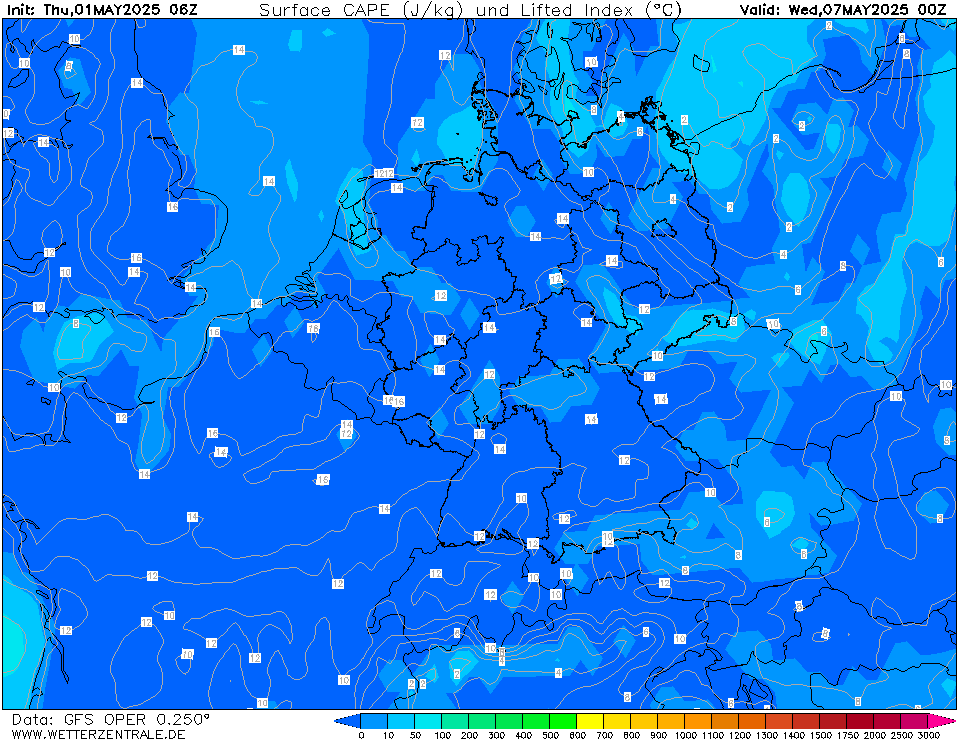
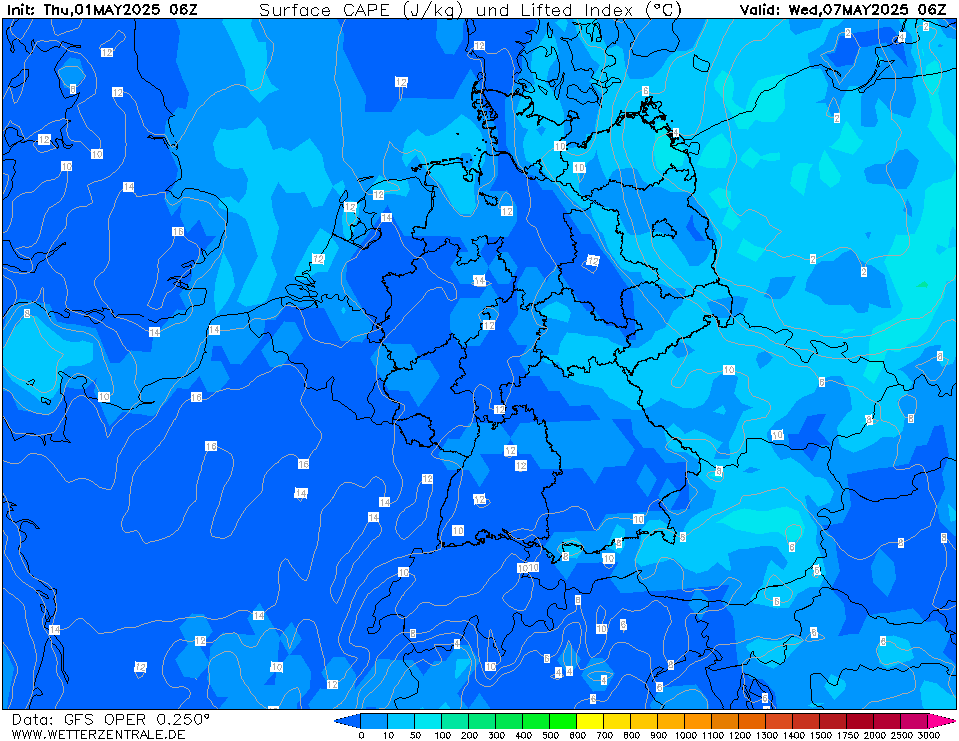
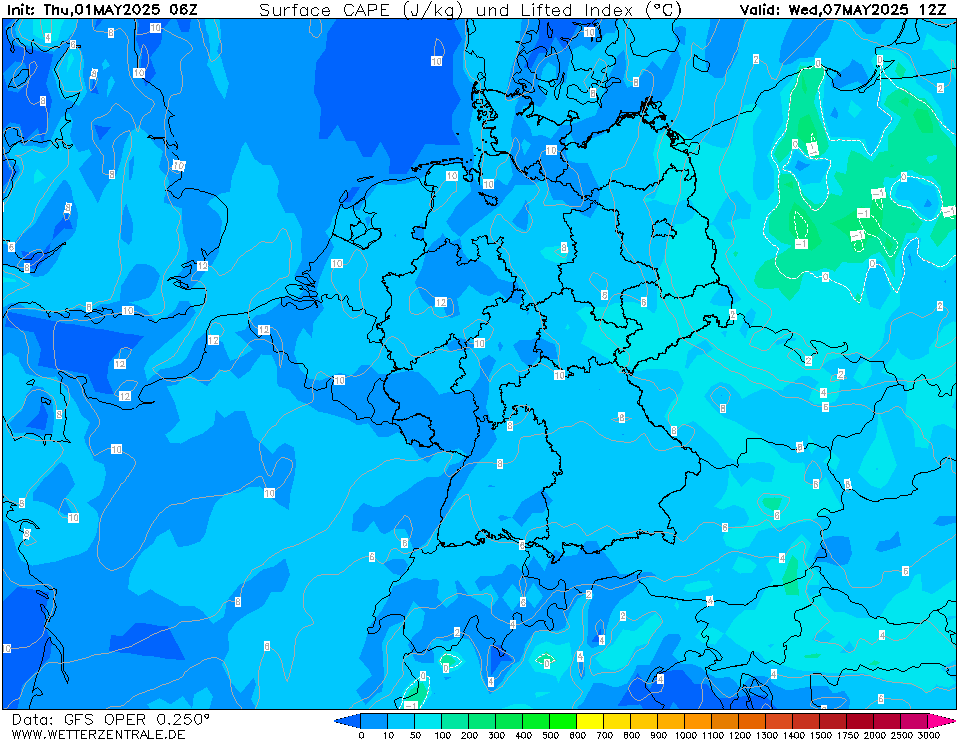
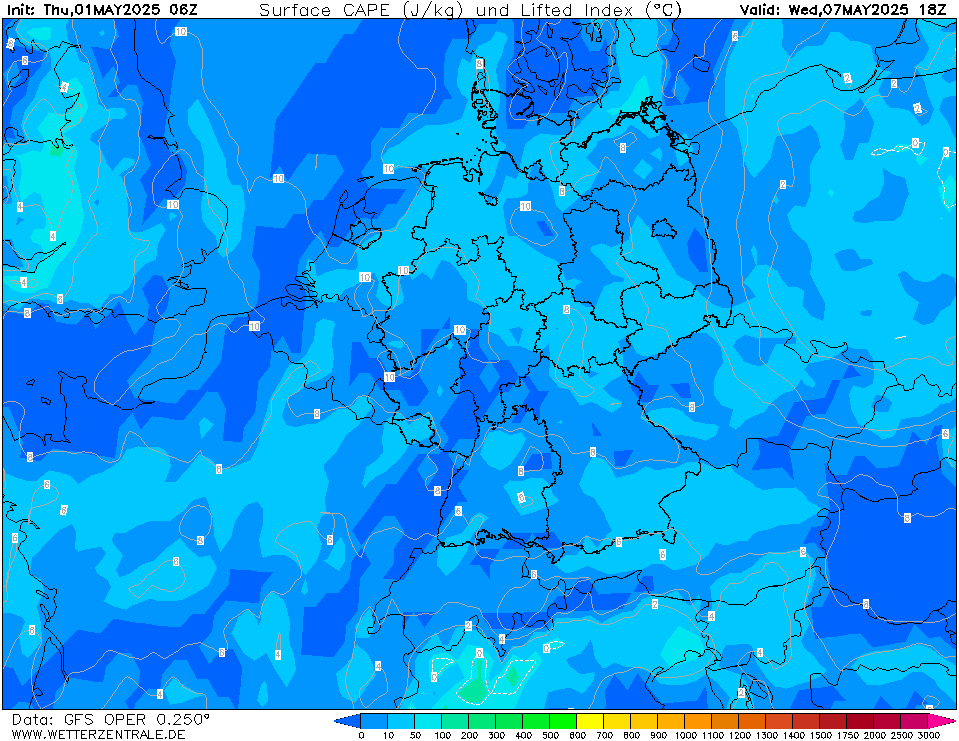
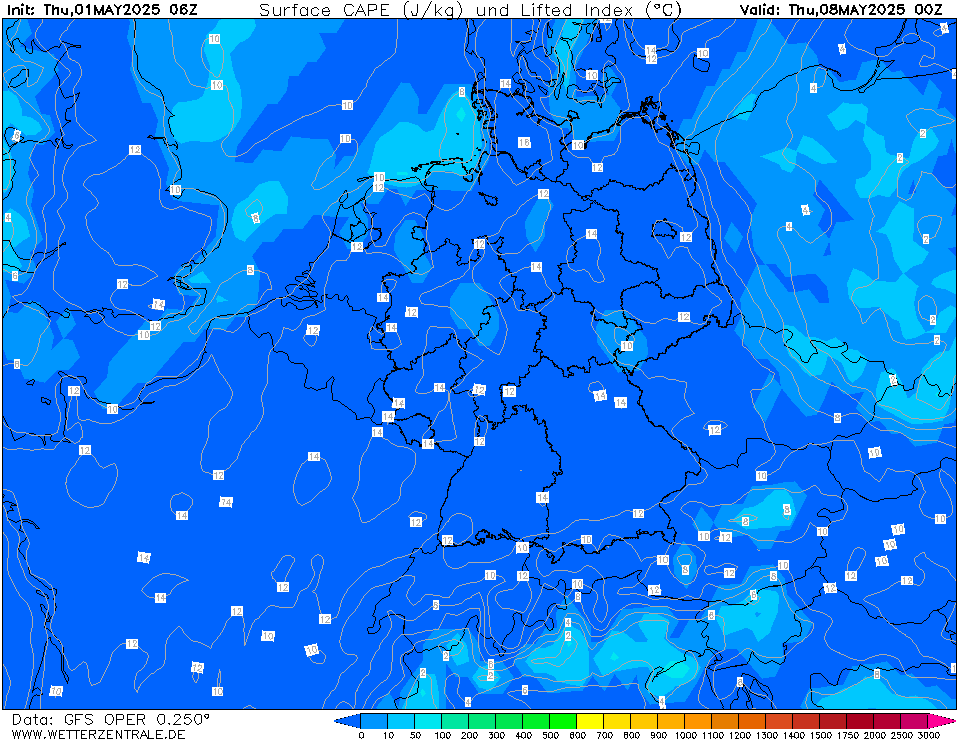

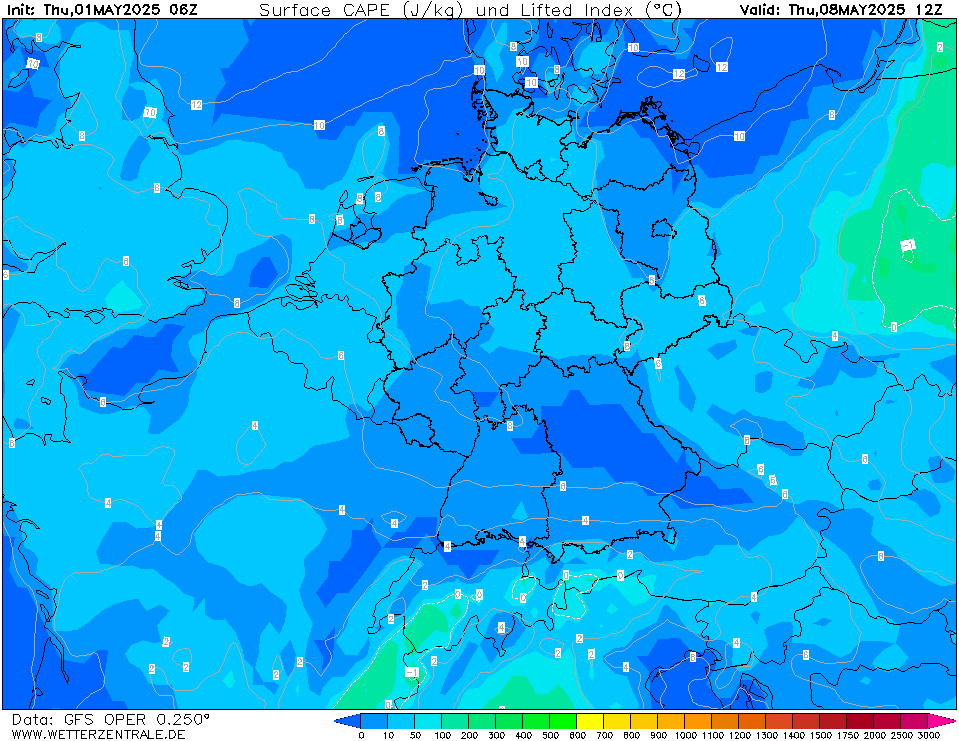
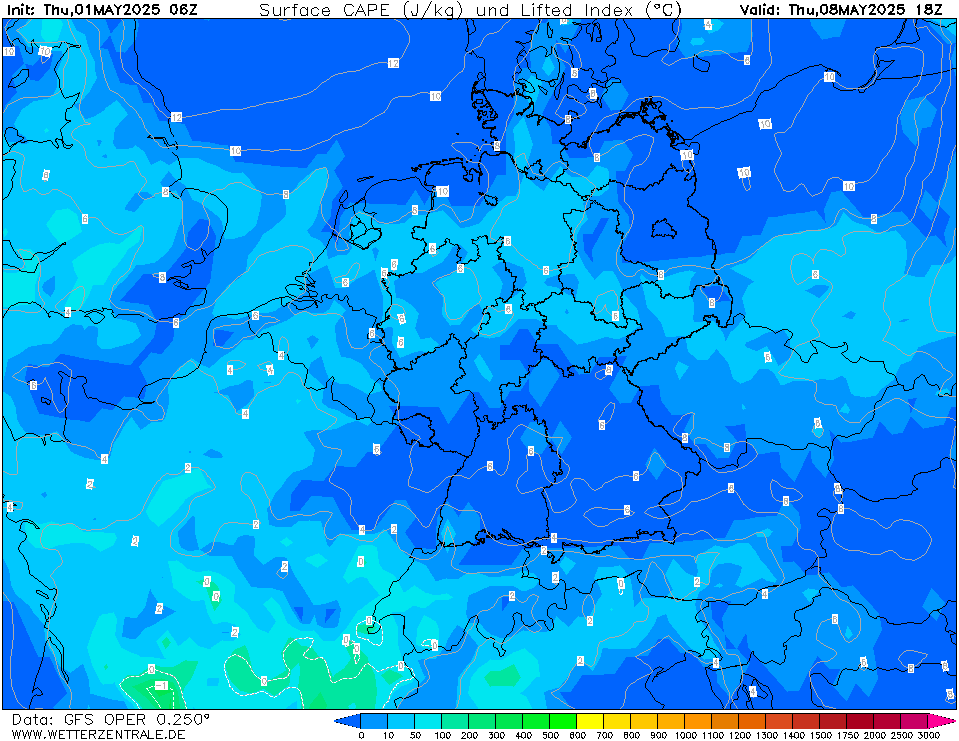
| Legend. Surface based CAPE (Convective Available Potential Energy) in Joule/kg = zones in color. Surface based LI (Lifted Index) in deg C = grey lines & values in white boxes. Both gives an idea about the severity of thunderstorms if they are formed.
Tests on the field shows there is no good correlation between CAPE
values and severe weather events. (Weak CAPE and strong wind shear may also
produce severe thunderstorms). Tests on the field shows there is good correlation between LI values < -5 and severe weather events. |
Back to weather forecasts for thunderstorms