SkyStef's weather page
|
|
SkyStef's weather page |
Satellite pictures by Meteosat
Visible (daylight only in local time)
Source: buienradar
Legend
| Visible images represent the amount of sunlight being scattered back into space by the clouds, aerosols, atmospheric gases, and the Earth's surface. Thicker clouds have a higher reflectivity (or albedo) and appear brighter than thinner clouds on a visible image. Some disadvantages are that these pictures are only useful during the daytime, and it is very difficult to distinguish among low, middle and high level clouds, since they can all have a similar albedo. Therefore, a switch to the infrared channel is very helpful. |
Source: buienradar
Legend
| Infrared satellite images are the measurements that are related to brightness temperature. Since temperature usually decreases with height, high level clouds are colder than low level clouds. Therefore, high level clouds appear brighter than low level clouds. One of the main advantages is that these pictures are also useful during the nighttime period. |
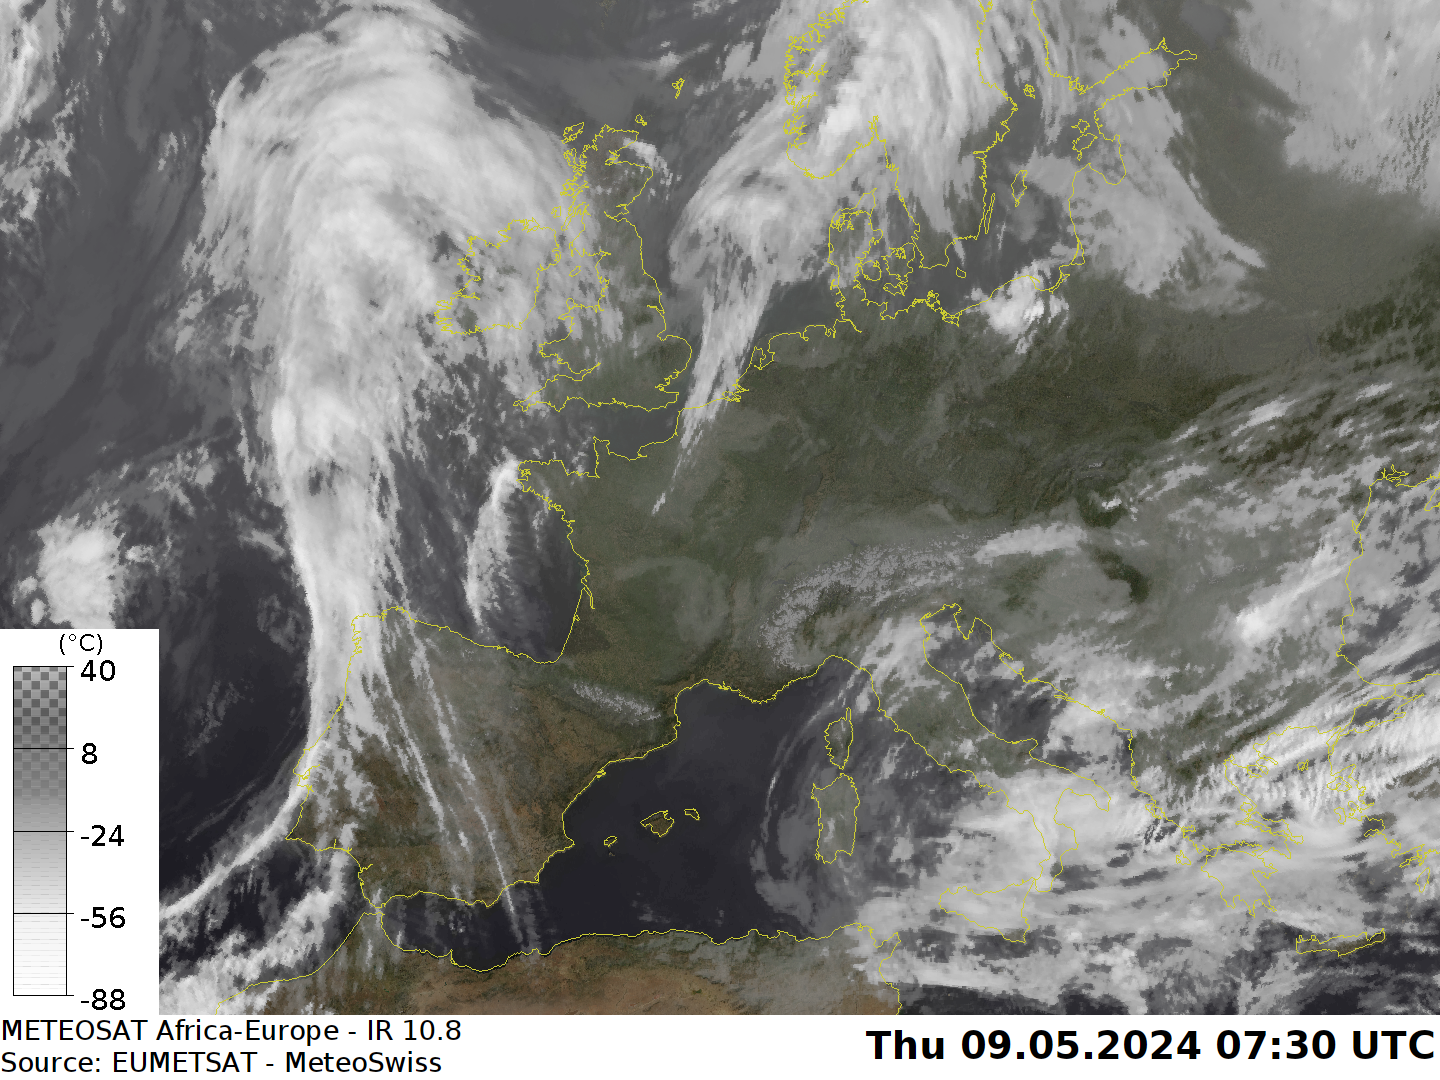
Source: MeteoSwiss
Legend
| Infrared satellite images are the measurements that are related to brightness temperature. Since temperature usually decreases with height, high level clouds are colder than low level clouds. Therefore, high level clouds appear brighter than low level clouds. One of the main advantages is that these pictures are also useful during the nighttime period. |
RGB (daylight only in UTC time)

Source: Eumetsat
Legend
| RGB stands for Red, Green and Blue. The RGB composite of 1.6 + 0.8 + 0.6 micron is often referred as "Day natural colors" composite, as it shows land in green / brown shades depending on the terrain brightness, and sea in dark shades. It has also the ability to show the water/ice phase of the clouds (water clouds reflecting much more on 1.6 microns than ice clouds), hence the blue colors of ice clouds. |
Water vapour (in UTC time)

Source: Eumetsat
Legend
Water vapour images approximately represent the humidity present in the middle troposphere. Bright areas mean moist air with a low potential vorticity and dark areas mean rather dry air with high potential vorticity. Bright and dark areas may also indicate rising and sinking motion. A sharp color gradient often indicates the position of a jet stream. |
Airmass (in UTC time)

Source: Eumetsat
Legend
| RGB airmass
is an
RGB composite based upon data
from infrared and water vapour channels and can thus be
used day and night. It is designed and tuned to monitor the evolution of
cyclones, in particular rapid cyclogenesis, PV (potential vorticity)
anomalies and jet streaks which enable us to notice jet fibres easily. High clouds appear in white colour, mid-level clouds in light ochre and cloud-free areas in dark green (warm air mass with high tropopause) or blue (cold air mass with low tropopause). A particular feature of this RGB is that dry descending stratospheric air is marked by a reddish colour. |
Dust (in UTC time)

Source: Eumetsat
Legend
| Dust RGB is a combination of IR channels and differences as follows: IR12.0-IR10.8, IR10.8-IR8.7, IR10.8. It helps to detect dust (evolution of dust storms over the desert), thin clouds and contrails. In this RGB combination thin high level ice clouds appear black and can be distinguished from thick clouds which appear red. |